


Disruptive Healthcare - Public and Private Market Valuation Multiples - 1/20/2024

Disruptive healthcare valuation, trends and analysis weekly. Always free. Subscribe:
The disruptive healthcare peers that we track are public companies, that feel more like early life cycle, high growth, high margin potential businesses than stodgy old mega-cap healthcare companies that are more mature in their life cycle. We track these names at What If Ventures because they are the closer in lifecycle, growth rate and profitability to the private companies that we invest in.
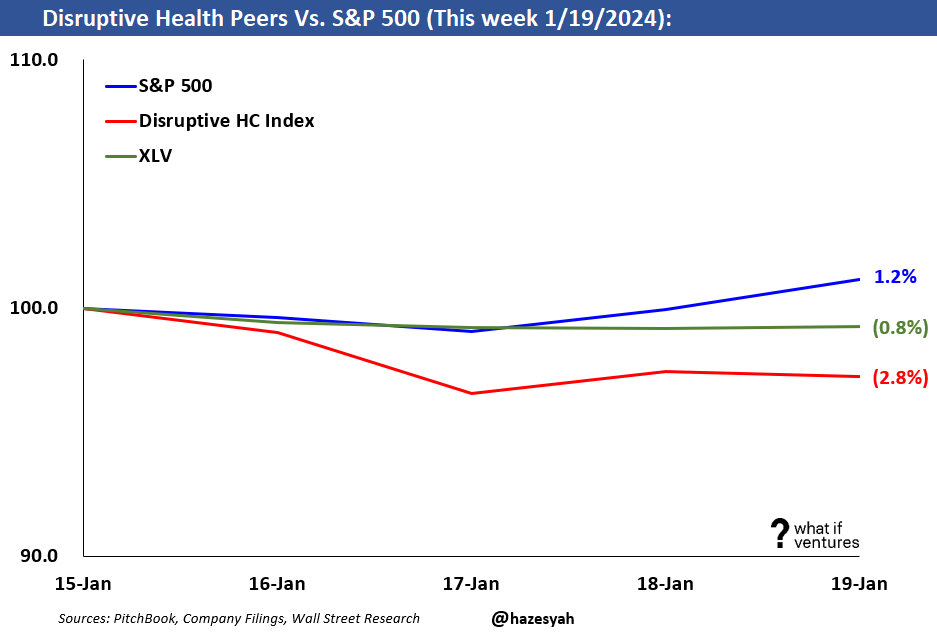
Since November, the disruptive healthcare peers have traded well above the broader market (see stock price charts below). However, since January 1st, the group has underperformed the broader S&P 500.
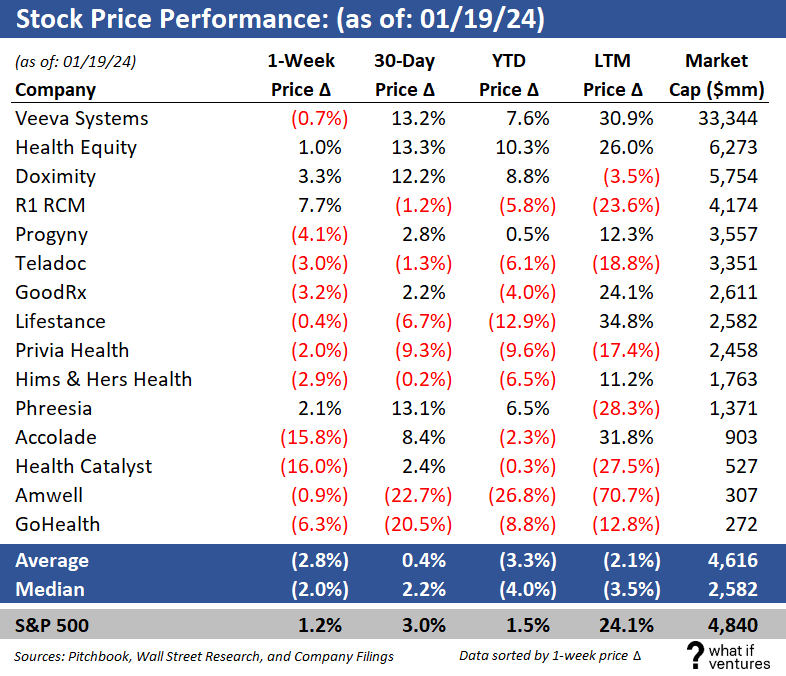
This week, was a bad week for our peer group on a relative basis. Our peers traded down 2.8% while the broader S&P500 traded up 1.5% on the week reaching a new all time high by Friday afternoon.
Below you can see the analysis we do weekly to stay on top of valuation trends in this market because these trends greatly influence the price of capital in our private market investing endeavors at What If Ventures.
At the very bottom of this post I’ve included some valuation multiples of private market deals I’m seeing right now on a no-names basis to help entrepreneurs get a sense of where the private companies are pricing rounds today as well.
Weekly Share Price Performance by Company
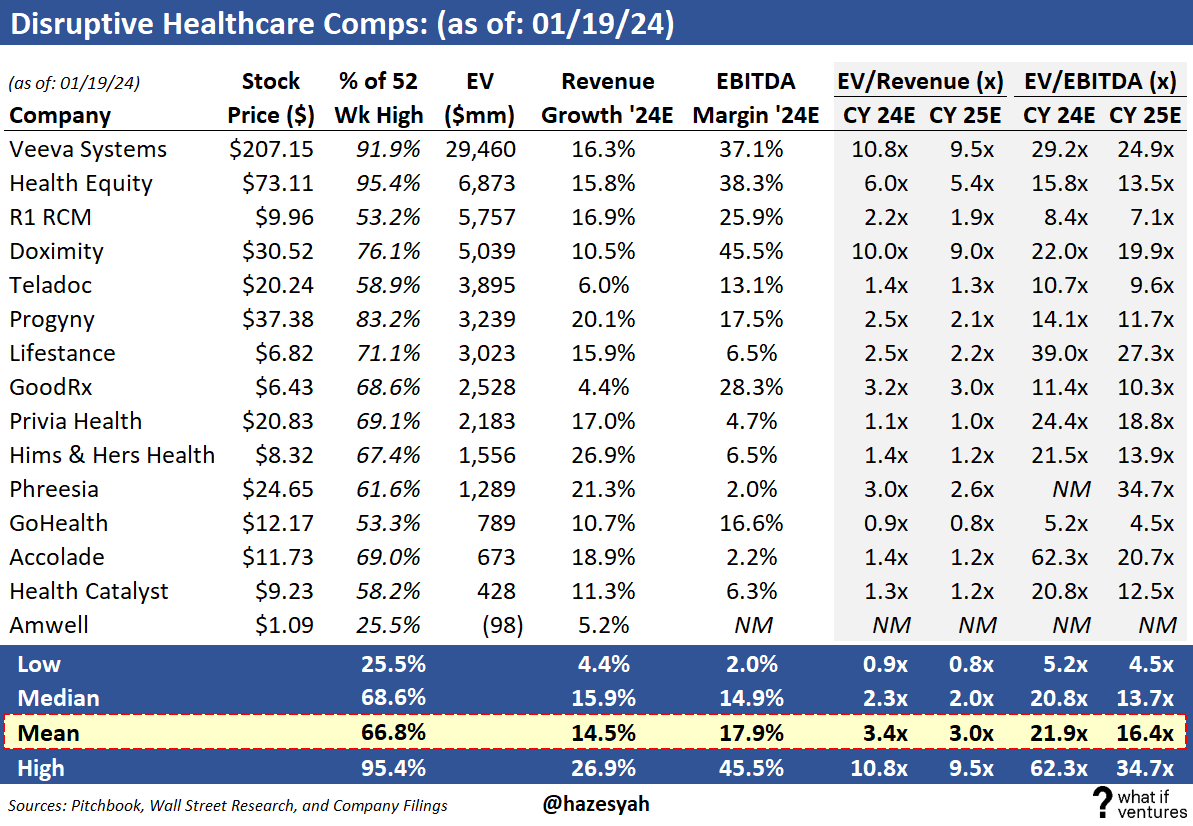
Disruptive Healthcare Public Comps
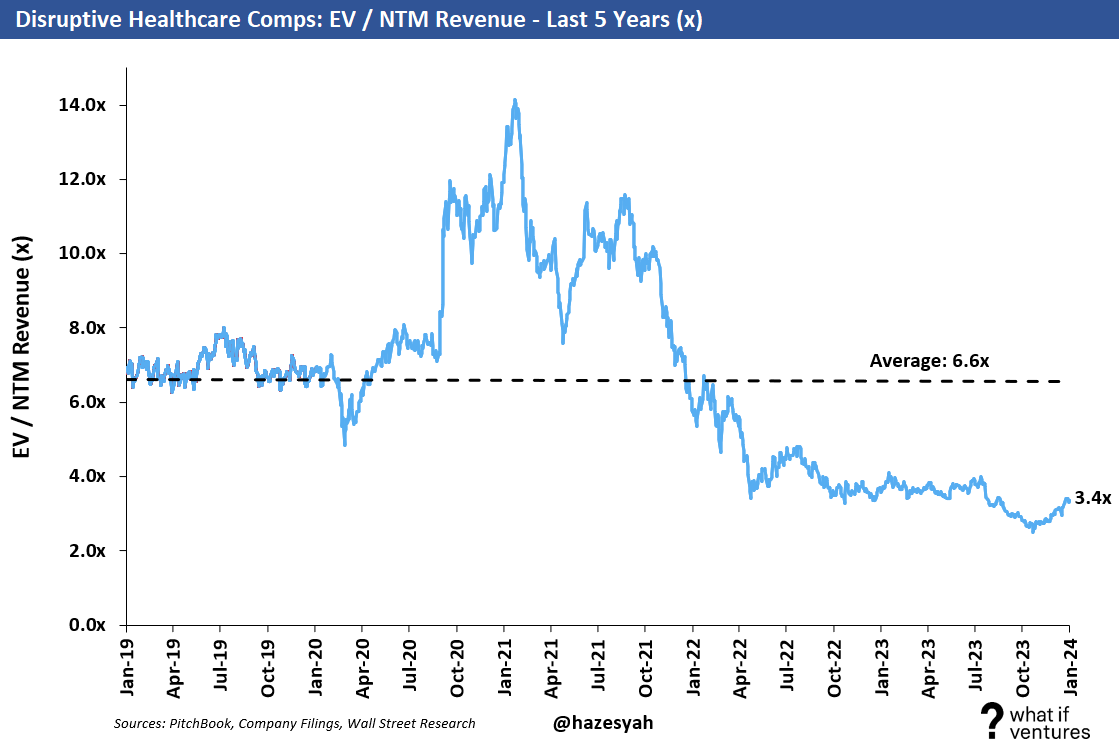
EV / NTM Revenue Multiple
Mature healthcare comps are generally valued based on their earnings. However, earlier stage businesses such as startups, and to an extent these younger, disruptive healthcare public companies often don’t have positive earnings yet or they may have positive earnings but they haven’t reached the margin profile they will achieve upon maturity as a business. As a result, it’s harder to compare these companies on an apples to apples basis using EV to earnings. So, we use EV/NTM revenue to compare these companies on a relative basis to each other and to themselves over time.
Summary Valuation Stats:
5 Year Average: 6.6x
Today: 3.4x
Peak: 14.1x
Trough: 2.5x
Stock Price Trends
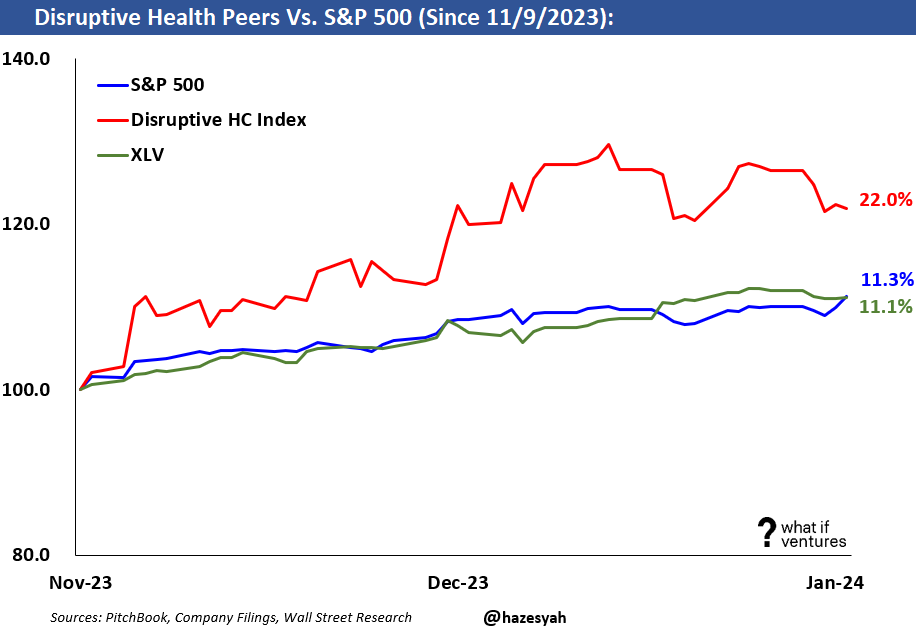
Over the last 12 months the disruptive healthcare peers have underperformed the S&P 500 broadly. As we noted in our post last week, the group has performed very well versus the S&P 500 since the bottom on 11/9/2023.
This week I’ve added the “XLV” to our charts. The XLV is the Health Care Select Sector SPDR Fund. This ETF gives investors exposure to companies in pharmaceuticals, health care equipment and supplies, health care providers and services, biotechnology, life sciences tools and services, and health care technology industries. XLV is the oldest ETF in the healthcare space, as such it is used widely for strategic or tactical positions by investors for broad based exposure to the healthcare industry. Since XLV is both cap weighted and fishes only from the S&P 500, it tilts heavily toward mega-caps (and our peers, are micro caps for the most part in comparison).
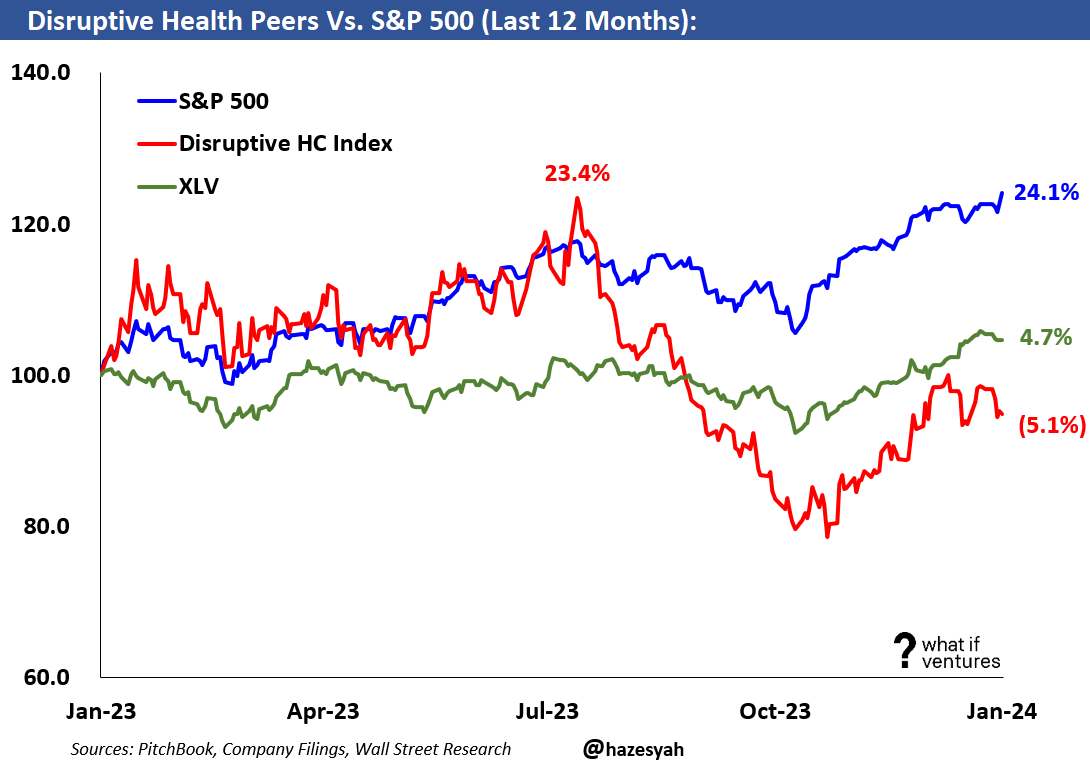
However, our peer group did not perform as well as the broader market this week. While the S&P 500 reached a new all time high this week, the disruptive healthcare peers traded down 2.8% on the week while the broader healthcare sector ETF was right in the middle between our group and the broader S&P500.
But, the peers are still doing better than the broader S&P 500 since the low point (11/9/2023), even though they gave up some of that lead this week. It’s interesting to see that since November, the XLV and the S&P 500 have traded just about evenly while the high growth disruptive healthcare peers have traded well above both groups. As the market began to price in a lower cost of capital environment, the high growth companies got a bigger boost, which makes sense. Over the coming weeks it will be interesting to see if the high growth group stays ahead or reverts back to where the broader market is trading.
Private Market Funding Round Valuations
Of course I can’t publish round sizes, valuations, or revenue numbers for private companies we’re investing in or considering investing in. However, I can put a few bullet points together on a no-names basis to give you a sense of how deals are pricing in the private markets right now. That’s probably more interesting to most of the readers of this post anyway.
Here are some multiples of revenue I’m seeing in deals that are about to close. This is just a collection of examples - and a very small sample size.
7.3x 2023 Revenue & 5.3x 2024E Revenue - This is for a growth equity stage care delivery business that generates above 35% gross margins and is growing 50% year over year.
3.7x Dec 2023 ARR - This is for a care delivery business that has a hybrid model of telehealth and in person care delivery. This Company is what I call mid stage (it’s not Series-A and it’s not quite mature enough to be a true growth equity company).
3.8x 2024E Revenue - This is for a care navigation business raising a Series-A.
I’ve been telling founders that private rounds are pricing around 5-6x revenue. This is slightly above the public peers, and in line with what I’m still seeing. There are exceptions to this rule in both directions. And of course, when people talk about valuation multiples of revenue they frequently compare apples to oranges by mixing ARR, LTM and NTM revenue multiples for comparison as if they are all the same thing. They are not.
I hope this is helpful!
If you would like to receive weekly updates on this data and our outlook on the Disruptive Healthcare market, then please subscribe and share our work with a friend.
About What If Ventures — What If Ventures invests in mental health and digital health startups from seed stage to growth equity. To date, we have invested over $80mm into 67 healthcare startups since January 2020.
If you have questions about any of this analysis or want to collaborate with What If Ventures, please reach out via info@whatif.vc. We’d love to connect with entrepreneurs and investors in the space.
You can follow more of my commentary on twitter here: @hazesyah