


Disruptive Healthcare 8/23/2024 - Healthcare Outperformance

Disruptive healthcare valuation, trends and analysis weekly.
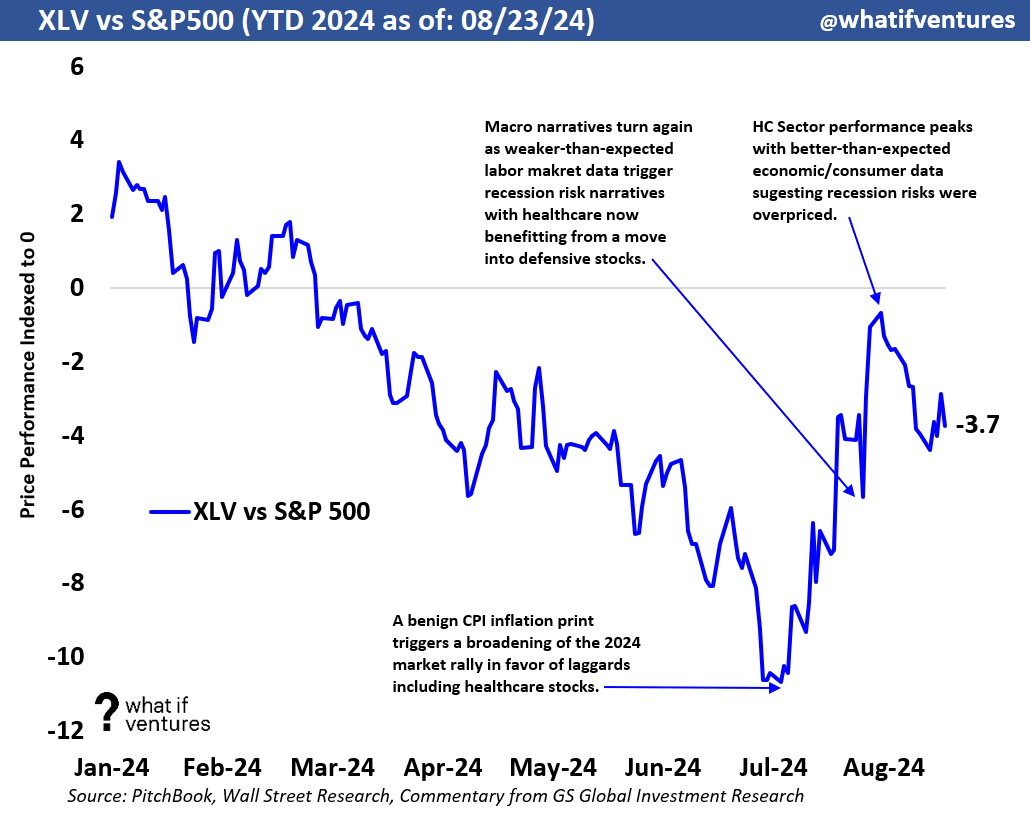
Healthcare Beating S&P 500 Post July 4th:
Since early July, the XLV has been outpacing the S&P500 quite nicely. In the chart immediately below, we indexed the XLV to the S&P500 to compare the relative price performance. When the line is moving upward, that means the XLV went up more than the S&P 500. While the XLV still has some catching up to do to beat the S&P 500 for the full year, you can see that since early July the XLV has outperformed nicely.
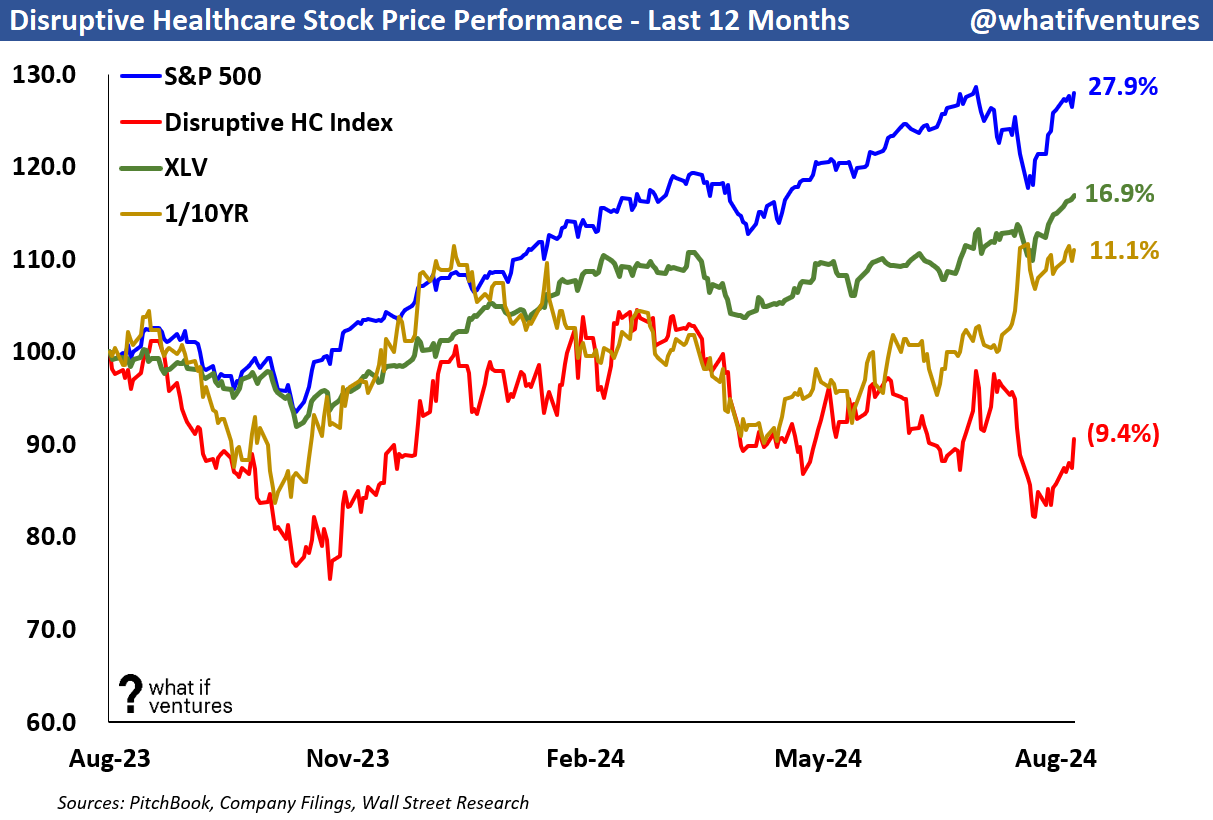
Disruptive HC Peers Also Beating S&P 500:
Since July 8th, the low point of the index shown above, the disruptive HC peers have also outperformed the S&P 500 with a huge relative move this past week (more on that below).

In the chat above you can see that the XLV (green) and the Disruptive HC Peers (red) have significantly outperformed the S&P 500 since the tide seemed to turn (as observed in the chart at the top of this page) in early July.
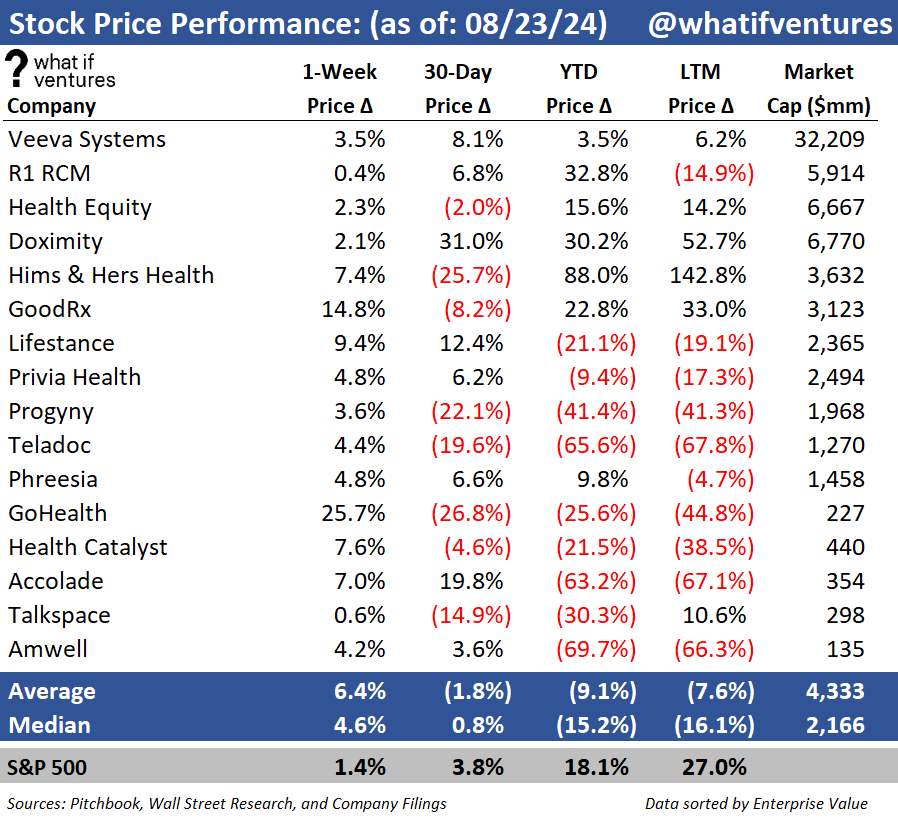
This week alone, the Disruptive HC peers outperformed the S&P 500 significantly. The Disruptive HC peers traded up 6.4% in one week while the S&P 500 traded up only 1.4% and the XLV was up only 1.9%. We should caveat that a large component of the move in our index was driven by GOCO trading up 25.5% on Friday alone as the stock recovered from being highly oversold. If you exclude GOCO from the group, the peers still traded up more than 5.0% on the week far outperforming the broader market carried in part by GDRX which saw their stock price tank after earnings and recover over the following days to lift the broader group as well this week. See below for company by company performance.

It appears that Healthcare broadly is coming back into favor in the public markets and as yield is harder and harder to find, we’re even seeing more risk taking with investors piling into the earlier stage (smaller market cap) names. This is playing out in the private markets too. I’m starting to see oversubscribed rounds at fuller valuations in Series-A and beyond compared to what we’ve seen over the last 12-18 months. Hopefully this continues!
Here is our stock price chart over the last 12 months for reference:
Stock Price Performance by Company:
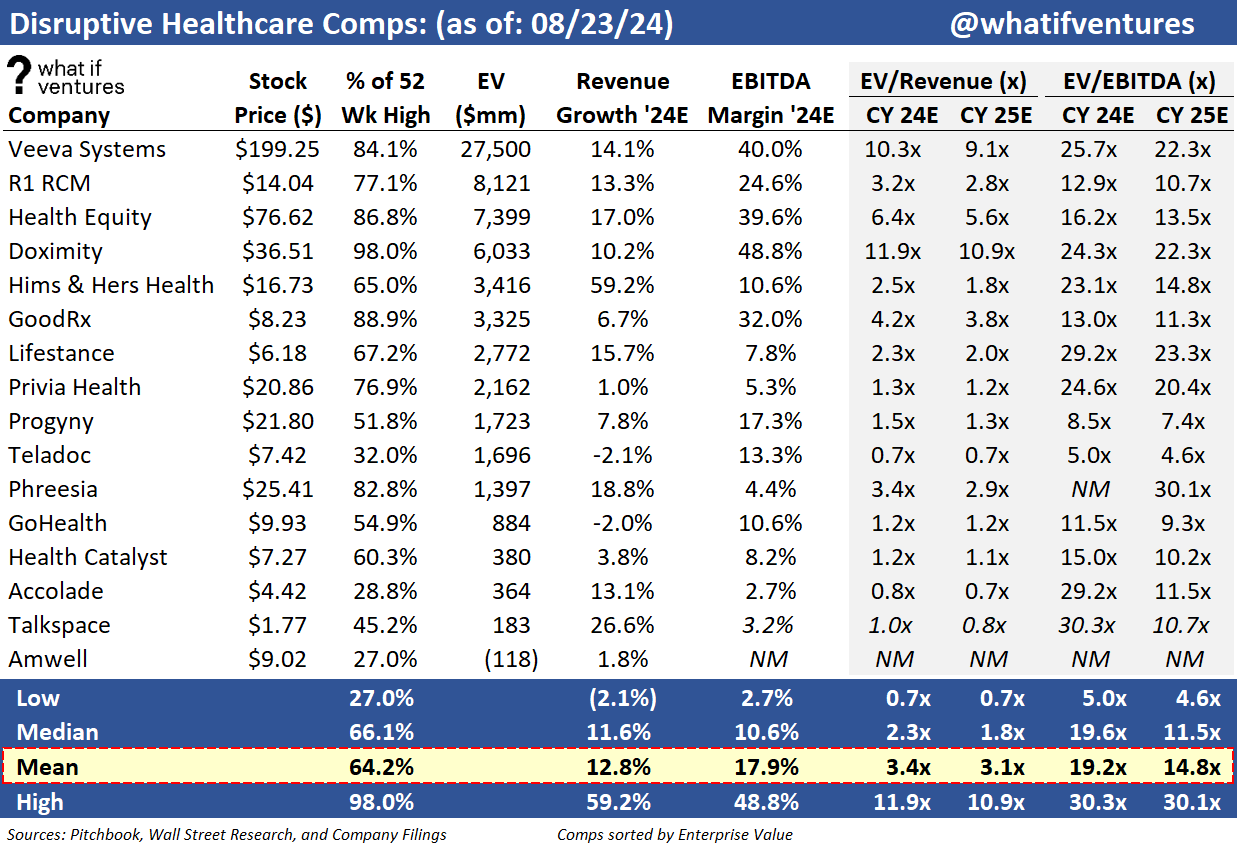
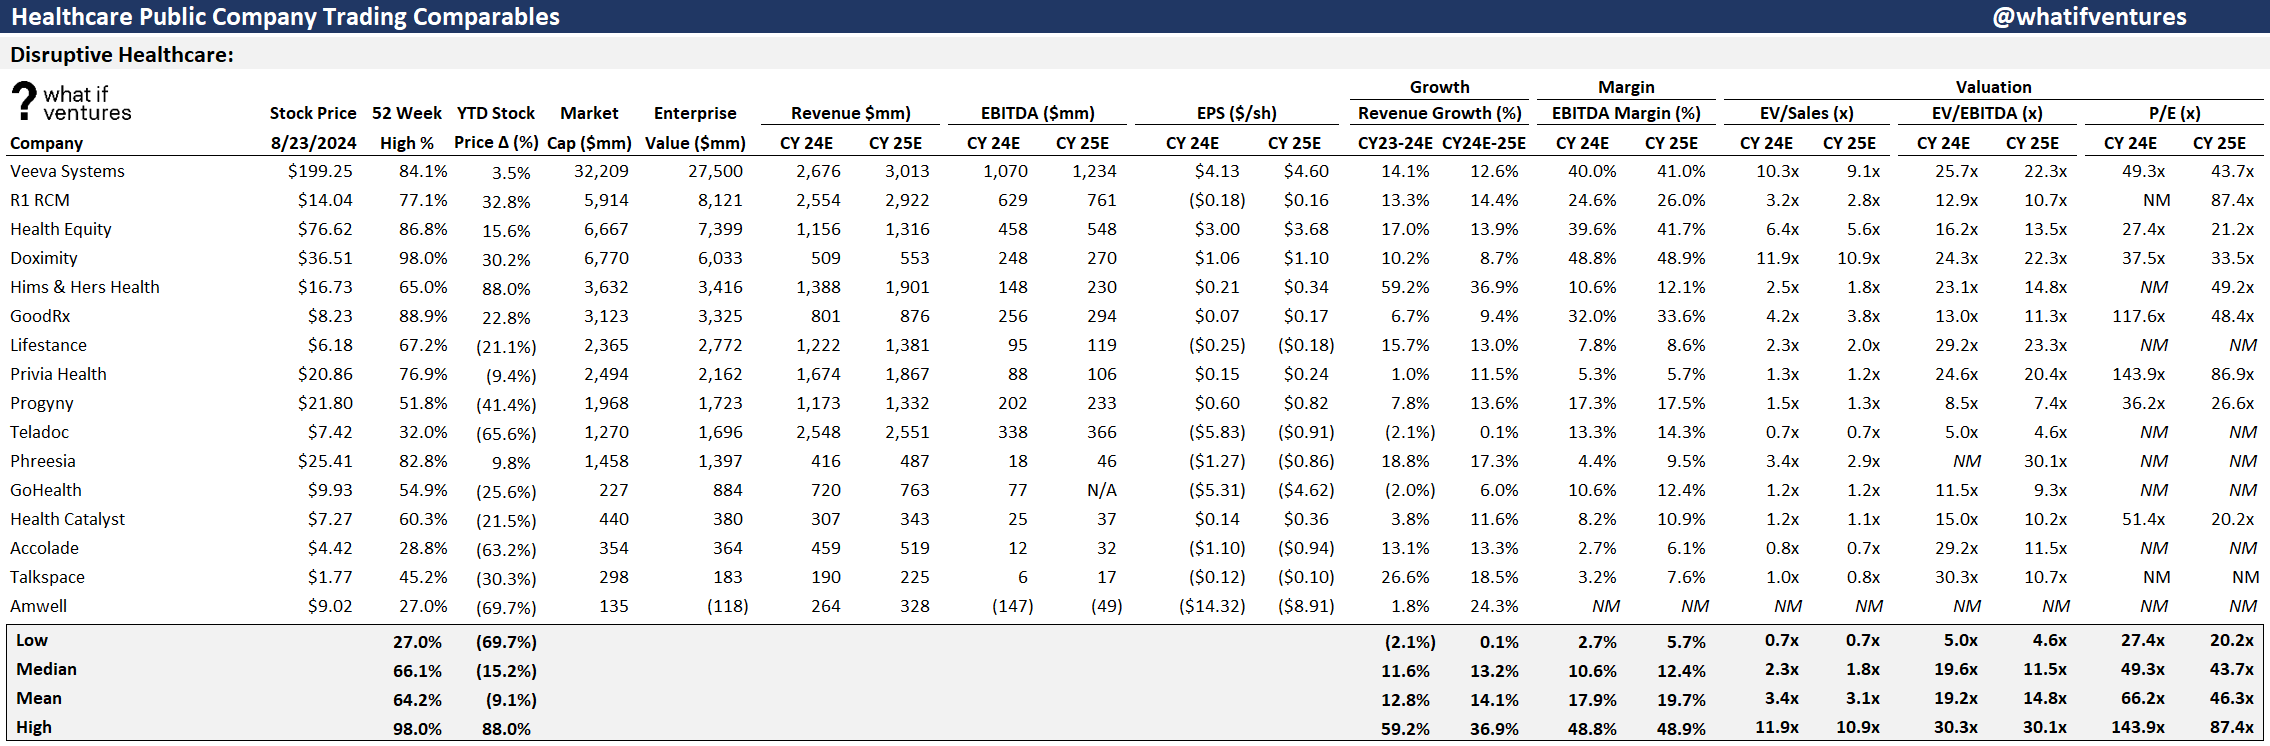
Disruptive Healthcare Public Comps:
Our Disruptive Healthcare peer group is currently trading at 3.4x 2024E revenue and 3.1x 2025E revenue which is a move up from last week.
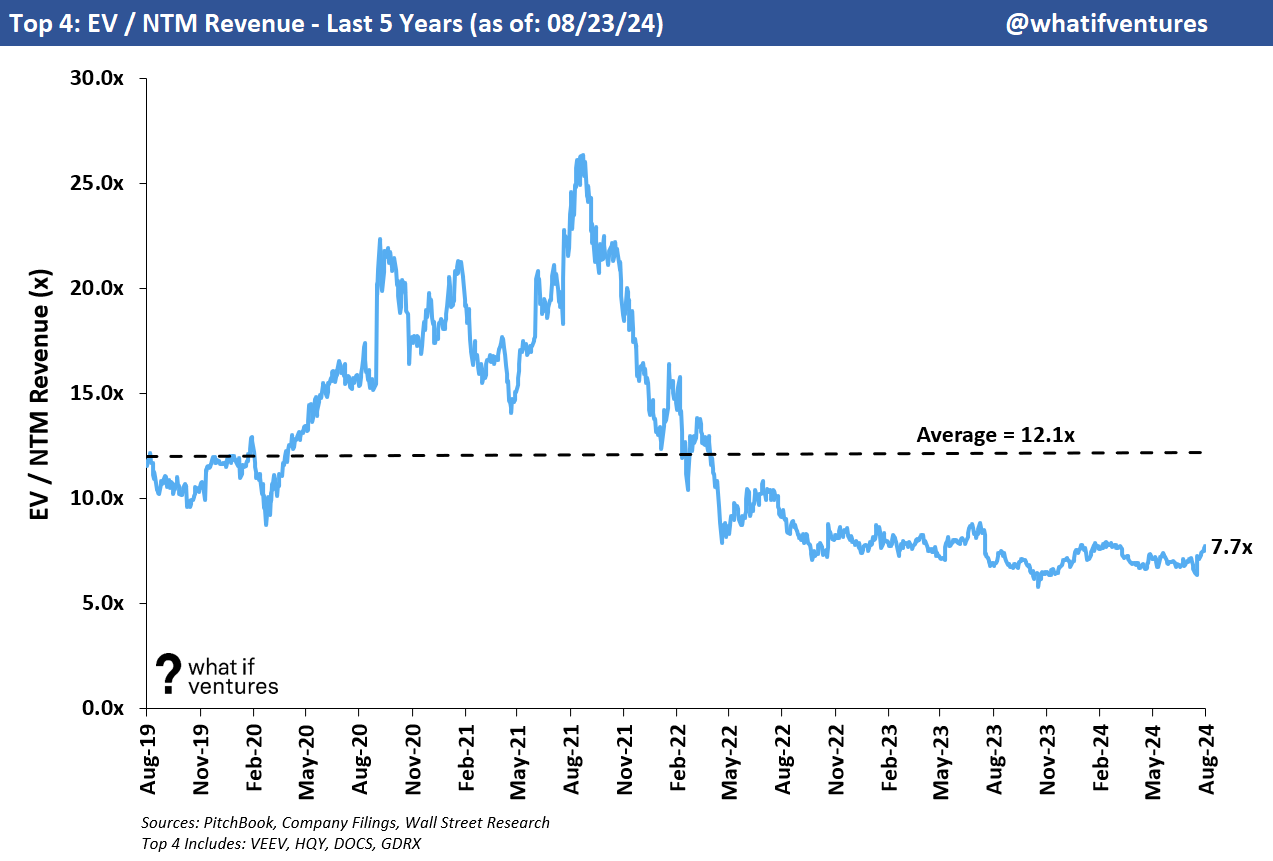
Top 4 Revenue Multiples:
This top 4 group is a subset of the broader disruptive healthcare peer set. These 4 currently have the greatest EV / 2024 Revenue multiples of the broader group. These 4 companies as a group trade at 8.2x 2024E revenue versus the broader group at 3.4x. This group also boasts an average EBITDA margin of 40.1% on 2024E projections versus the broader group at 17.9% 2024E EBITDA margin.

Why does this matter to startups?
These comps aren’t perfect. They are public companies and most startups are several years away from being public. But, when I look at how early stage startup funding rounds are pricing in the healthcare sector, the ARR multiples aren’t too far off of these high growth “top 4” peers. Tracking these valuation metrics is a decent proxy for tracking capital flows, and investor sentiment in the sector. As the public markets trade up, and yield is difficult to find in a sector, investors often start seeking yield in more illiquid assets. This drives capital down to the private markets and drives valuations up. Tracking this flow of capital in the broader capital markets helps us think about what to expect for our portfolio in terms of when to access the markets and when to wait for better days to raise money.
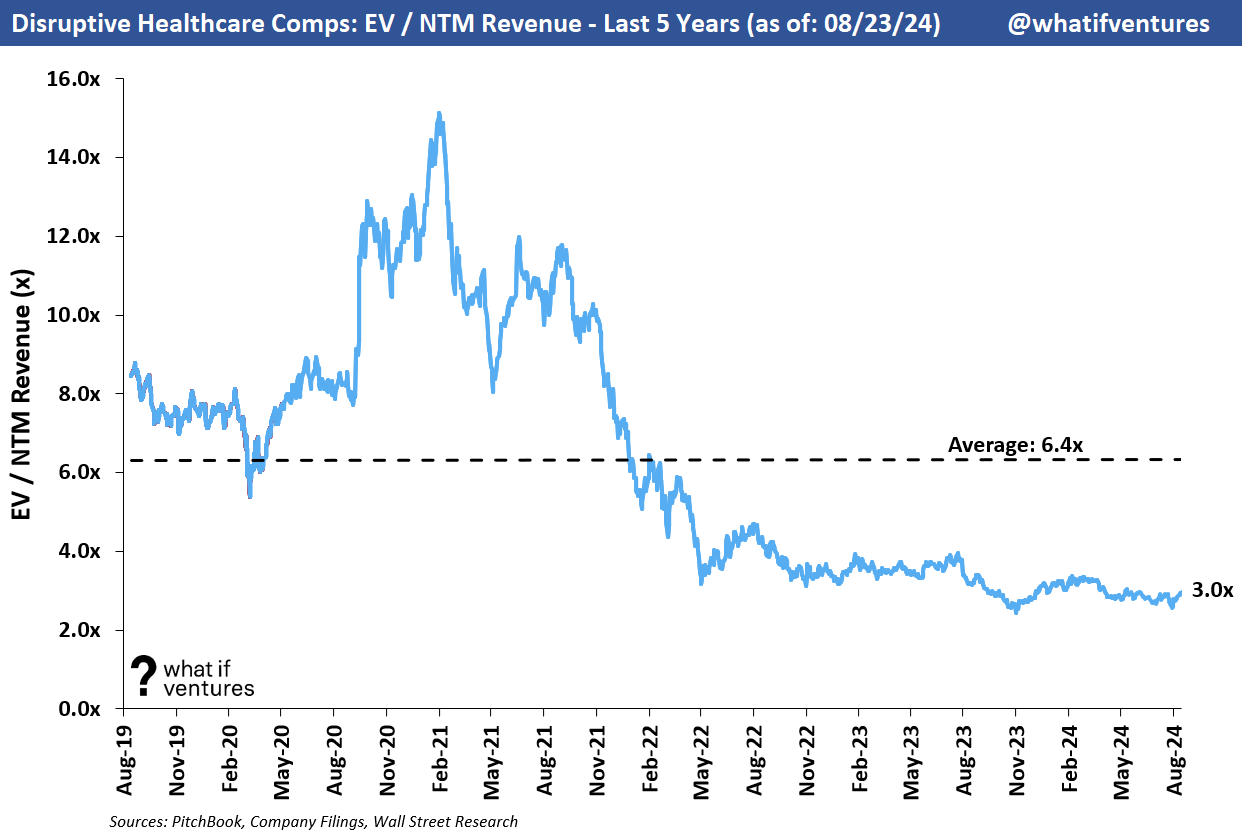
Valuation — EV / NTM Revenue:
Mature healthcare comps are generally valued based on their earnings (see the broader comps at the bottom of this post). However, earlier stage businesses such as startups, and to an extent these younger, disruptive healthcare public companies often don’t have positive earnings yet or they may have positive earnings, but they haven’t reached the margin profile they will achieve upon maturity as a business. As a result, it’s harder to compare these companies on an apples-to-apples basis using EV to earnings. So, we use EV/NTM revenue to triangulate valuation for these companies and for startups in similar markets.
Summary of EV / NTM Revenue Valuation Stats:
5 Year Average: 6.4x
Today: 3.0x
Peak: 15.1x
Trough: 2.4x
Summary of top 4 EV / NTM Revenue Valuation Stats:
5 Year Average: 12.1x
Today: 7.7x
Peak: 26.4x
Trough: 5.8x
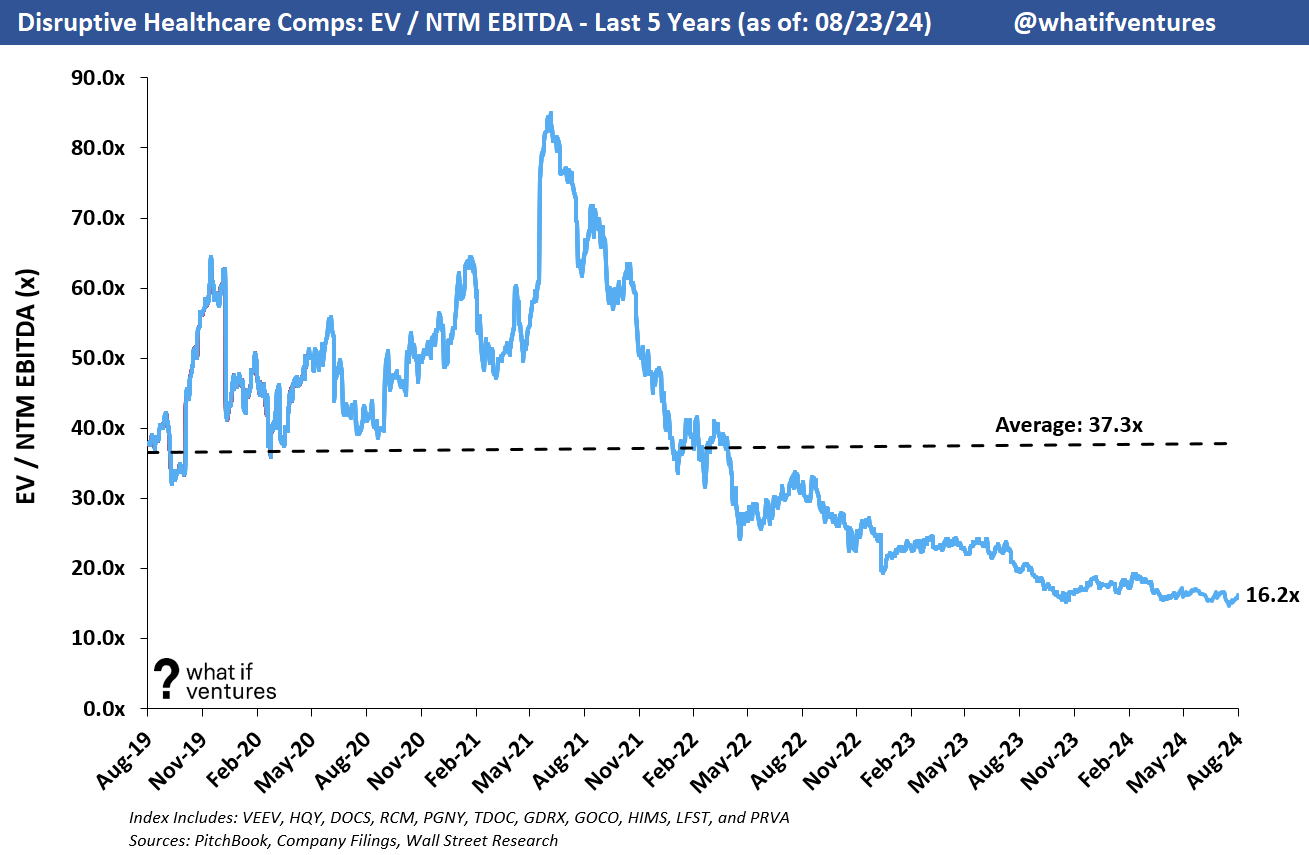
Valuation — EV / NTM EBITDA:
We were previously only looking at 8 companies from the perspective of EV/NTM EBITDA, but since Q1 earnings have reported, more analysts are projecting positive EBITDA in 2024 and beyond for more of the peers so we have expanded the index here to include 11 of the 16 companies. Based on what I’m seeing in equity research I think we will be adding a few names to this list soon as more of our peer group is starting to approach profitability.
To create an index, I only include the peers who have a substantial believable positive NTM EBITDA forecast based on the average of Wall Street equity research reports. The comps with barely positive EBITDA yield EBITDA multiples that aren’t realistic (so we consider them not meaningful “NM”).
The included companies are: VEEV, HQY, DOCS, RCM, PGNY, TDOC, GDRX, GOCO, HIMS, LFST, and PRVA. That’s not to say the other Companies won’t have positive EBITDA in 2024, but the multiples are relevant right now. Here’s how the chart looks.
Summary EV / NTM EBITDA Valuation Stats:
5 Year Average: 37.4x
Today: 16.2x
Peak: 85.0x
Trough: 14.6x
As these companies mature and begin to trade on EBITDA multiples or even P/E multiples (much like the hospital facilities and MCO peers) then this chart will tell us more. This is certainly a data point we can look at for profitable growth equity stage private companies. I’d expect those companies to be valued closer to the 5-year average or slightly lower. Some of that data in 2019 and 2020 is elevated because the EBITDA estimates back then were very small or barely positive for some of these companies driving an artificially high multiple that wasn’t driving valuation but rather was a dependent variable.
Broader Healthcare Comps as of 8/23/2024:
This newsletter is mostly focused on the disruptive healthcare comps and how their performance drives valuation for our private market portfolio at What If Ventures. However, we do keep a much broader set of comps that includes Healthcare Facilities and Managed Care Organizations.
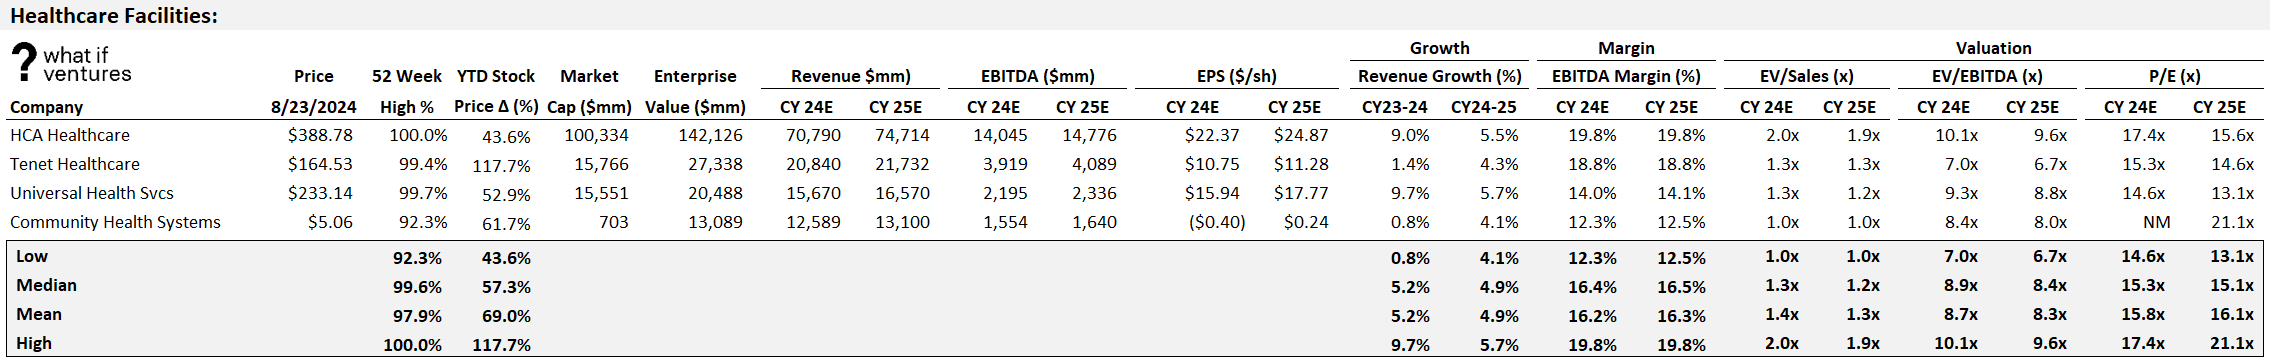

^I realize this is too small to read, but if you double click on the image it should expand. Or you can just email me and I’ll send you the backup.
If you would like to receive weekly updates on this data and our outlook on the Disruptive Healthcare market, then please subscribe and share our work with a friend.
About What If Ventures — What If Ventures invests in mental health and digital health startups from seed stage to growth equity. To date, we have invested over $90mm into 75 healthcare startups since January 2020. The firm is actively managed by Stephen Hays.
If you have questions about any of this analysis or want to collaborate with What If Ventures, please reach out via info@whatif.vc. We’d love to connect with entrepreneurs and investors in the space.
You can follow more of Stephen’s commentary on twitter here: @hazesyah
What is the Disruptive HC Index, and who constructs it?