


Disruptive Healthcare 4/4/2025 - Tough Week for Everyone
Latest Comps - Updated 4/4/2025

Disruptive healthcare valuation, trends and analysis. Weekly/Monhtly-ish.
I’ve been delinquent this year on updating my comps and publishing. I’m sorry about that. I hope this update is helpful. It’s just a data dump. I hope to update this more frequently.
I thought this week would be a good time to price-update everything considering the carnage in the markets this week.
Disruptive Healthcare Public Comps:
Our Disruptive Healthcare peer group is currently trading at 3.4x 2025E revenue and 3.0x 2026E revenue. Not too far off from where they were when I last published this in January.

Top 5 Revenue Multiples:
This top 5 group is a subset of the broader disruptive healthcare peer set. These 5 currently have the greatest EV / 2025 Revenue multiples of the broader group. These 5 companies as a group trade at 7.1x 2025E revenue versus the broader group at 3.4x. This group also boasts an average EBITDA margin of 33.4% on 2025E projections versus the broader group at 17.7% 2025E EBITDA margin.

Disruptive HC Peer Stock Price Performance:
Our peer group has lagged the XLV and the S&P500 for the last 12 months. Toward the end of January and into February, our peer group surged on HIMS performance, but that has pulled back since then.
Peer performance vs. broader market over the last 12 months:

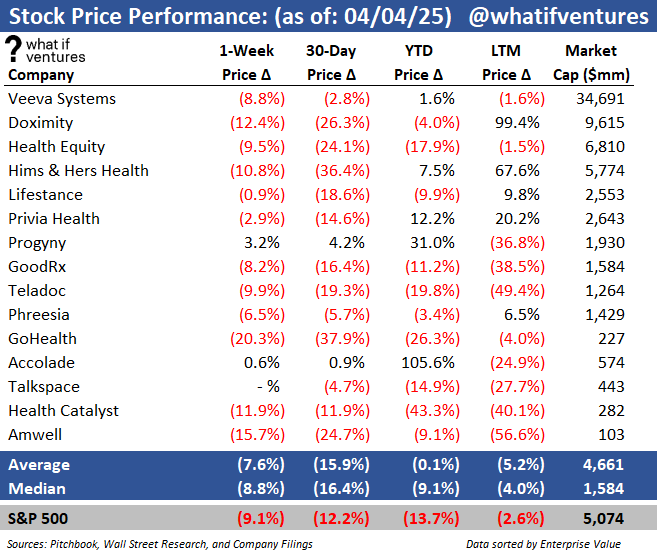
Peer performance vs. broader market over the last 1 week:
This week was pure carnage in the markets broadly. There weren’t many places to hide even though our peers fared slightly better than the broader market.

Stock Price Performance by Company:
Valuation — EV / NTM Revenue:
Mature healthcare comps are generally valued based on their earnings (see the broader comps at the bottom of this post). However, earlier stage businesses such as startups, and to an extent these younger, disruptive healthcare public companies often don’t have positive earnings yet or they may have positive earnings, but they haven’t reached the margin profile they will achieve upon maturity as a business. As a result, it’s harder to compare these companies on an apples-to-apples basis using EV to earnings. So, we use EV/NTM revenue to triangulate valuation for these companies and for startups in similar markets.
Summary of EV / NTM Revenue Valuation Stats:
5 Year Average: 6.1x
Today: 3.3x
Peak: 16.0x
Trough: 2.4x

Summary of top 5 EV / NTM Revenue Valuation Stats:
5 Year Average: 9.4x
Today: 6.9x
Peak: 20.3x
Trough: 4.7x


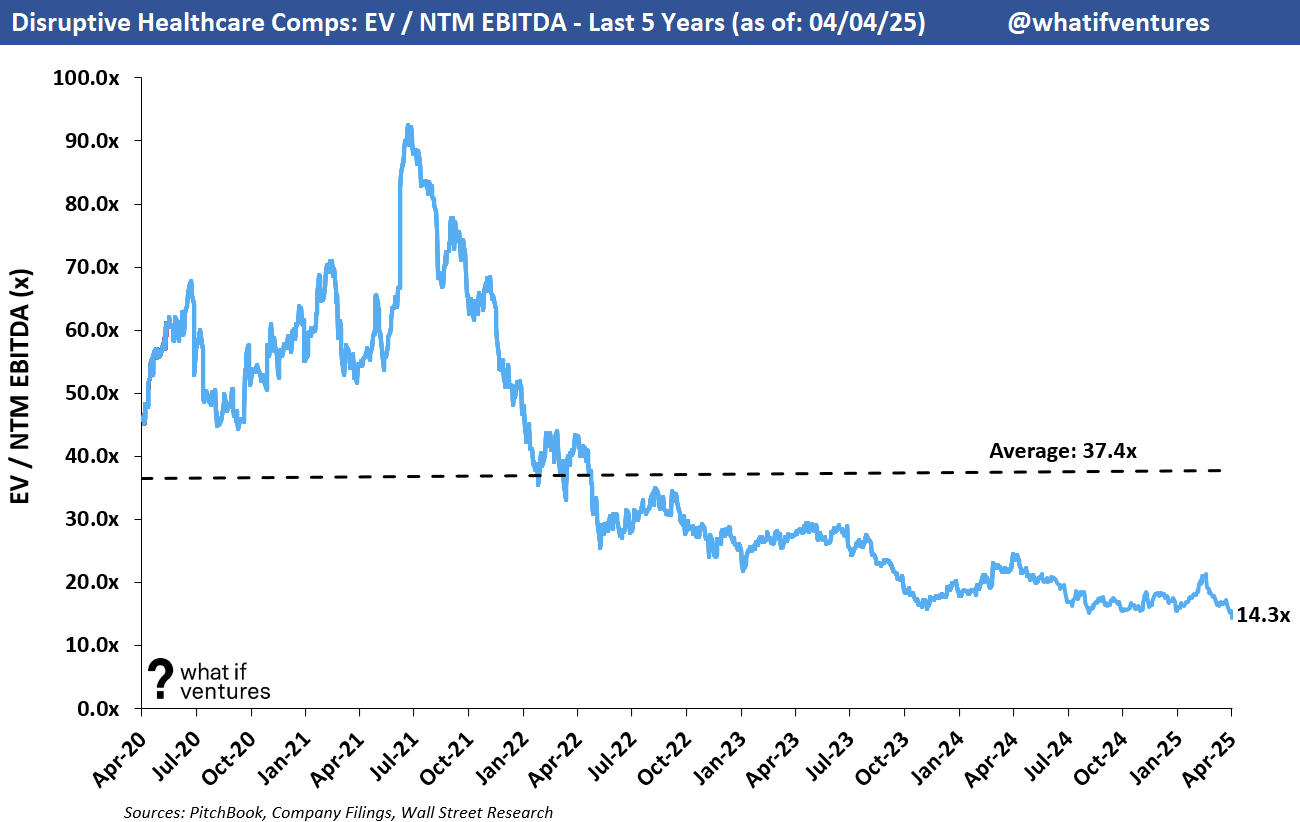
Valuation — EV / NTM EBITDA:
A year ago we were only looking at 8 companies on an EV/EBITDA basis because half of our peer group had negative EBITDA forecasts. Now, all but one company has a positive EBITDA forecast for the next 12 months so this multiple has become more useful for us.
Summary EV / NTM EBITDA Valuation Stats:
5 Year Average: 37.4x
Today: 14.3x
Peak: 92.5x
Trough: 14.3x

Broader Healthcare Comps as of 4/4/2025:
This newsletter is mostly focused on the disruptive healthcare comps and how their performance drives valuation for our private market portfolio at What If Ventures. However, we do keep a much broader set of comps that includes Healthcare Facilities and Managed Care Organizations.


If you would like to receive weekly updates on this data and our outlook on the Disruptive Healthcare market, then please subscribe and share our work with a friend.
About What If Ventures — What If Ventures invests in mental health and digital health startups from seed stage to growth equity. To date, we have invested over $100mm into 87 (mostly) healthcare startups since January 2020. The firm is actively managed by Stephen Hays.
If you have questions about any of this analysis or want to collaborate with What If Ventures, please reach out via info@whatif.vc. We’d love to connect with entrepreneurs and investors in the space.
You can follow more of Stephen’s commentary on twitter here: @hazesyah
Hi there, I’ve enjoyed your work. I’m a long-time gastroenterologist and I just joined Substack as well. I’ve been blogging for 16 years, but on another platform. I hope you'll follow me at mkirsch.substack.com. Best wishes!