


Disruptive Healthcare 4/26/2024: Looking For a Bottom

Disruptive healthcare valuation, trends and analysis weekly.
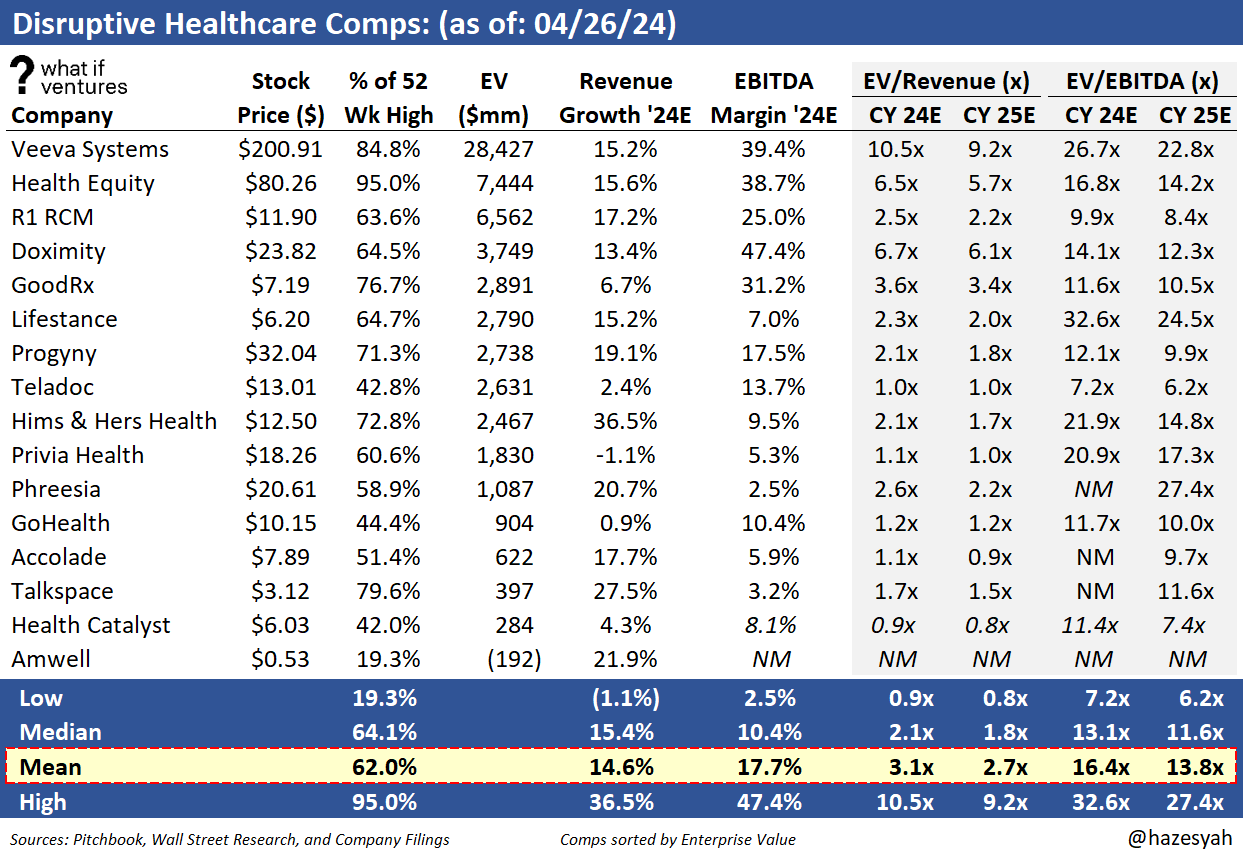
Disruptive Healthcare Public Comps:
Our Disruptive Healthcare peer group is currently trading at 3.1x 2024E revenue and 2.7x 2025E revenue.
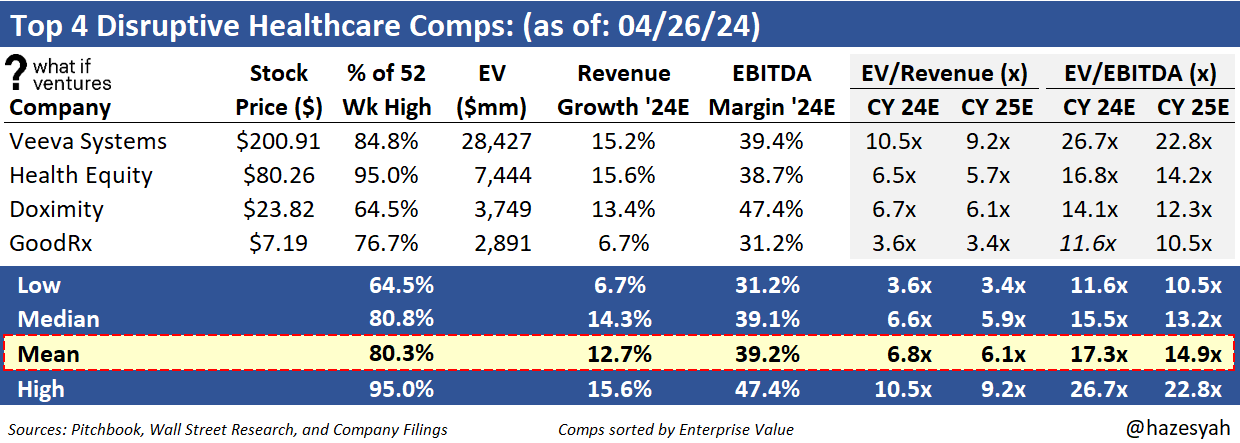
Top Revenue Multiples:
This top 4 group is a subset of the broader disruptive healthcare peer set. These 4 currently have the largest EV / 2024 Revenue multiple. This group trades at 6.8x 2024E revenue versus the broader group at 3.1x. This group also boasts an average EBITDA margin of 39.2% on 2024E projections versus the broader group at 17.7% 2024E EBITDA margin on average.
Peer Stock Price Performance:
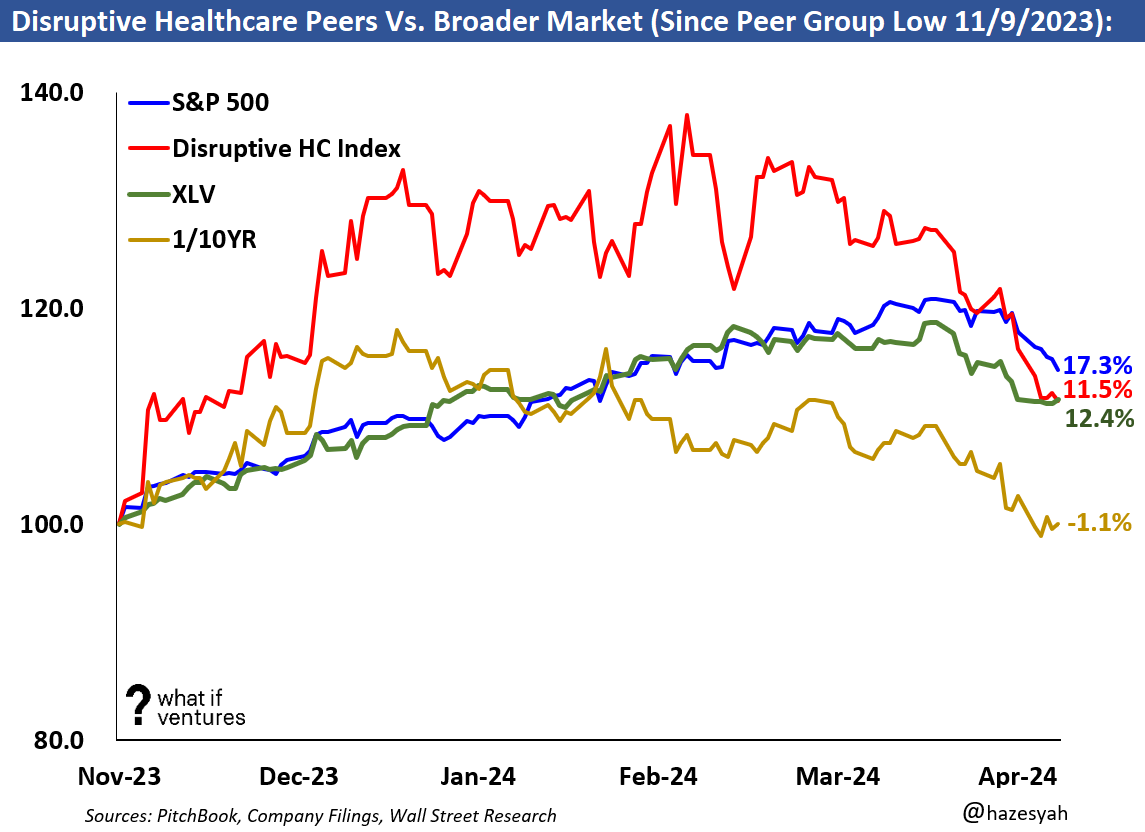
Back to Where We Started:
Interest rates have been driving the markets for quite some time now. It’s worth noting that in recent weeks interest rates have traded above where they were when our peers reached a multi-year low on November 9th, 2023. However, today, with rates at that same price, the XLV is trading at $139.95 versus $124.51 back in November. The Disruptive Healthcare peers are trading up 11.5% since the November low against that same backdrop. See the next chart below for a visual on this.
Where do we go from here? What is going to “give” first? Stock prices, or interest rates? Or are investors getting more comfortable with higher interest rates for longer? We will learn more in the coming weeks. The biggest question in front of us right now is whether or not the November low, was the bottom for this group.
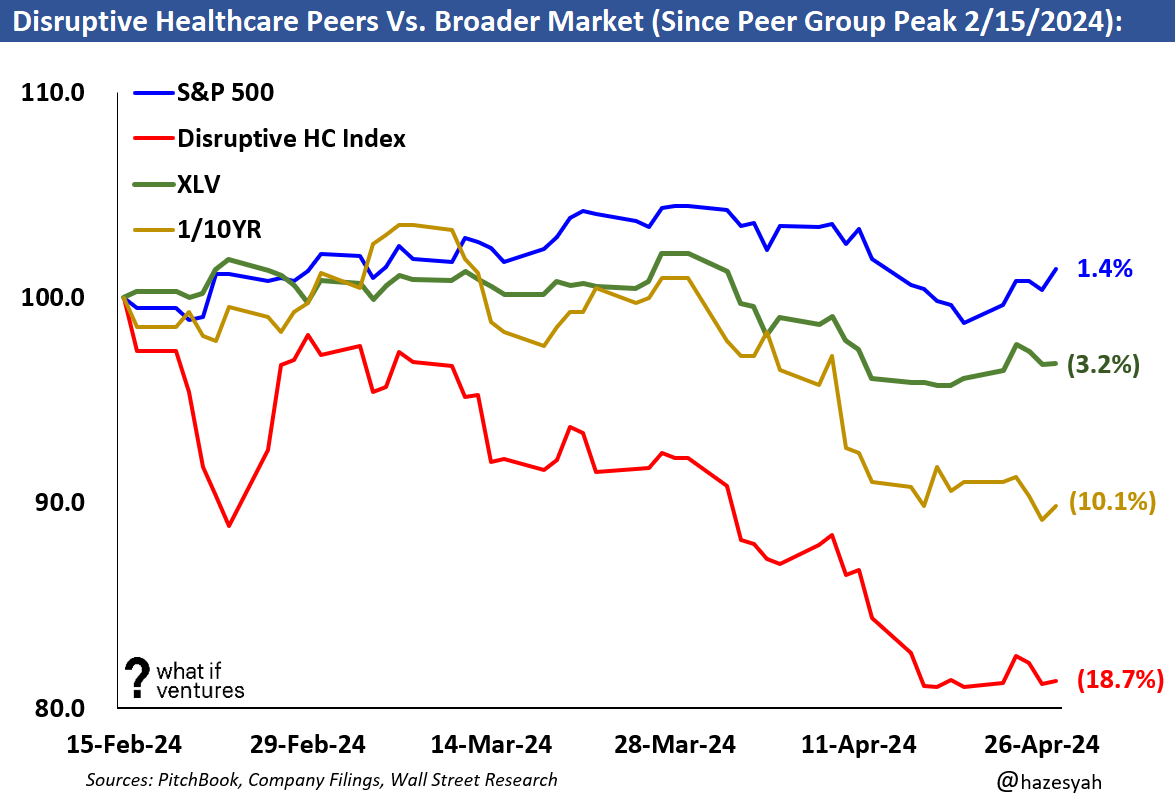
Conversely, let’s see what our peers look like since their recent peak. Disruptive HC peers peaked as an index back on 2/15/2024. Since then, our peers have traded down 18.7% while the S&P is up 1.4% and the broader XLV index is down 3.2%. Over the same time the 10-year rate has risen 10.1% relative to where it was on 2/15 reaching 4.67% on Friday April 26th.
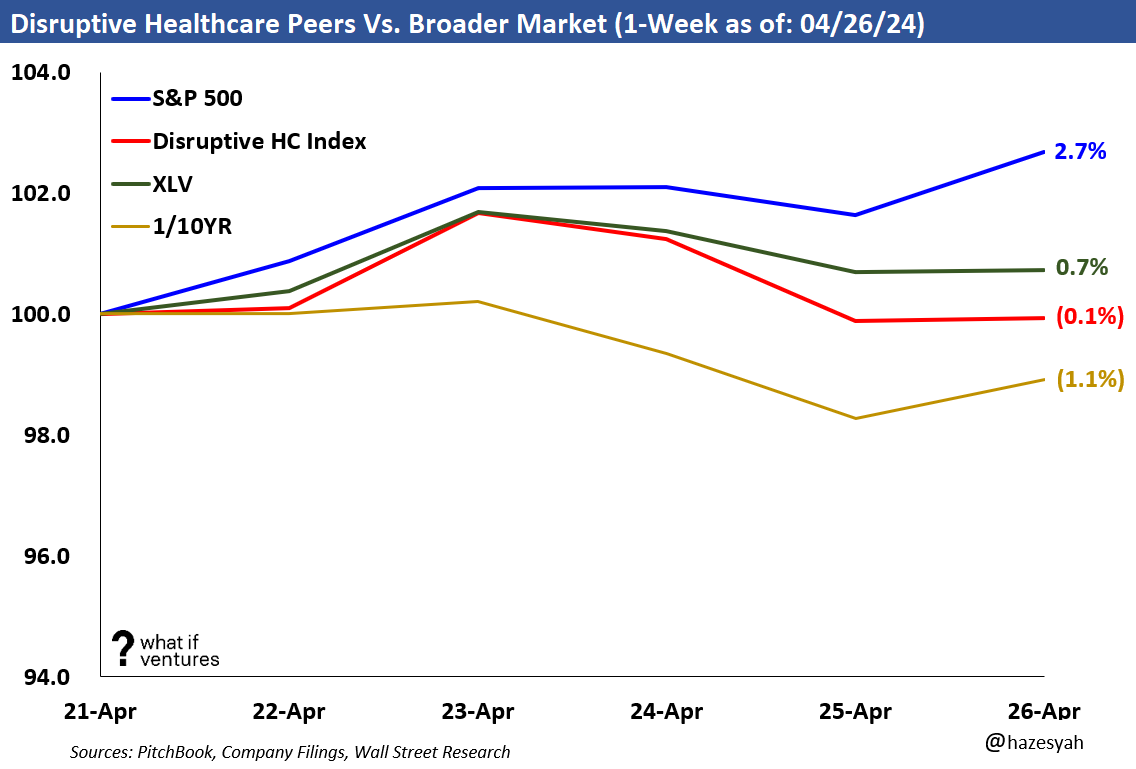
Peer stock price performance this past week:
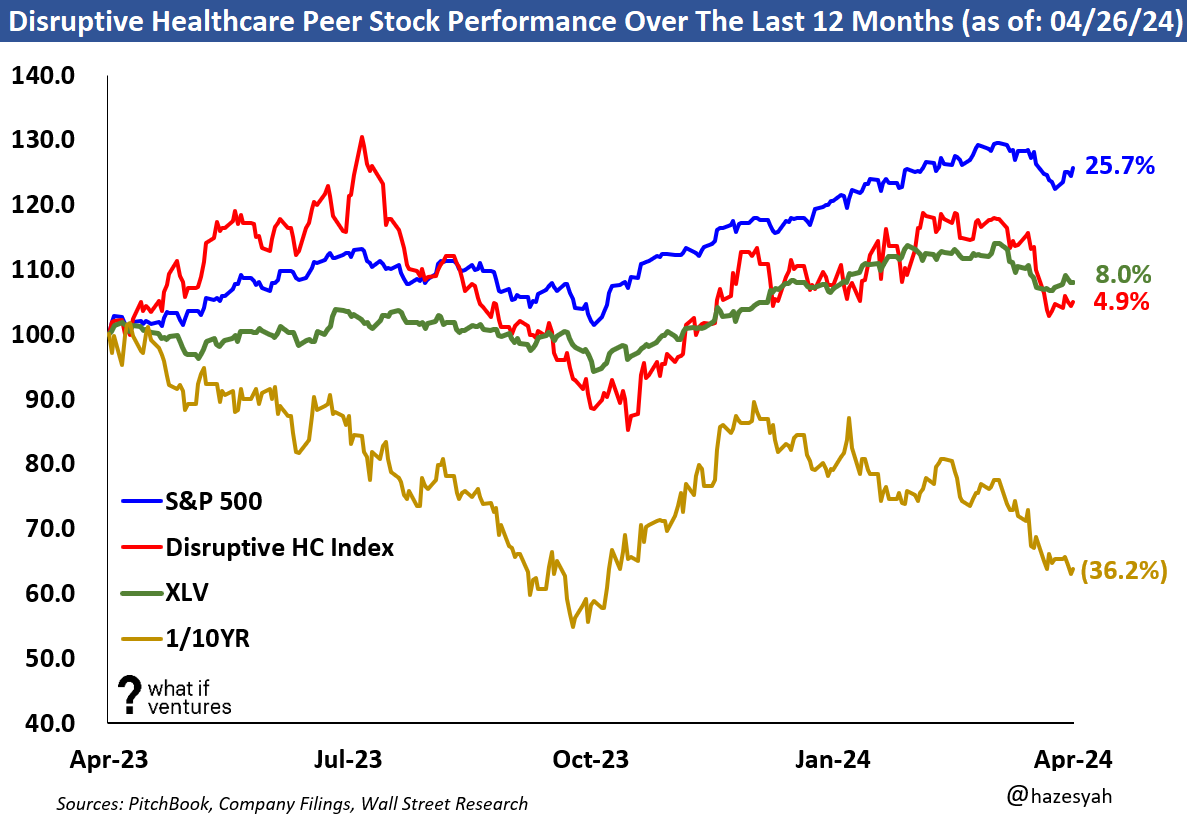
Here’s how the public stocks in our space have traded over the last 12 months:
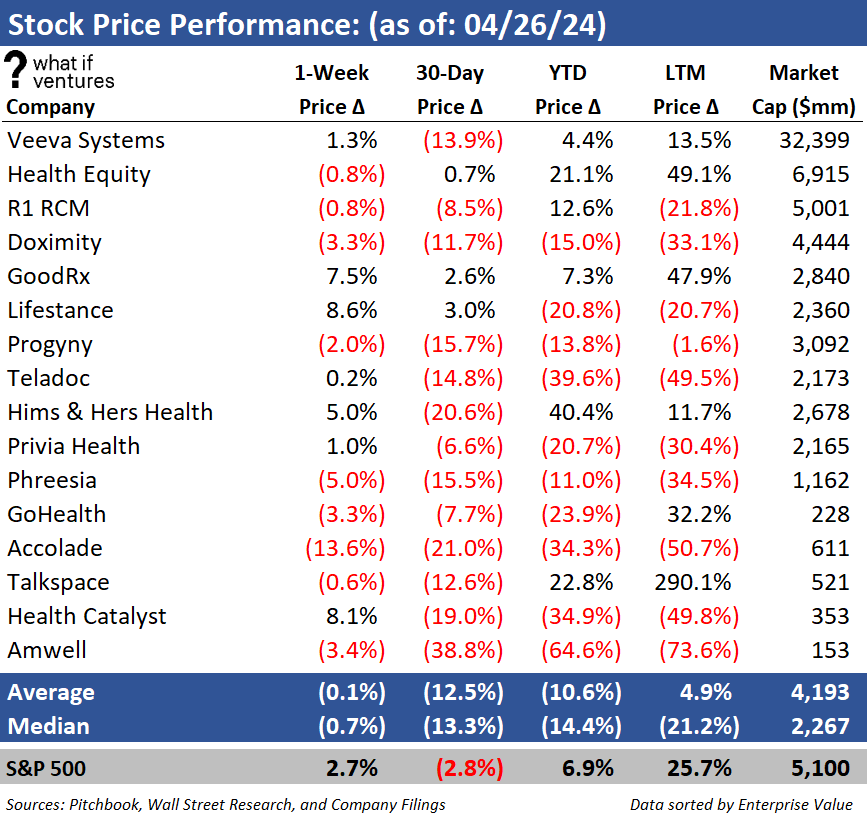
Weekly Share Price Performance by Company:
This week was another tough week for our peer group. The comps traded down 0.1% on average after trading down 3.7% in the prior week. This represents another week of weaker performance versus the S&P 500 which traded up 2.7% this week.
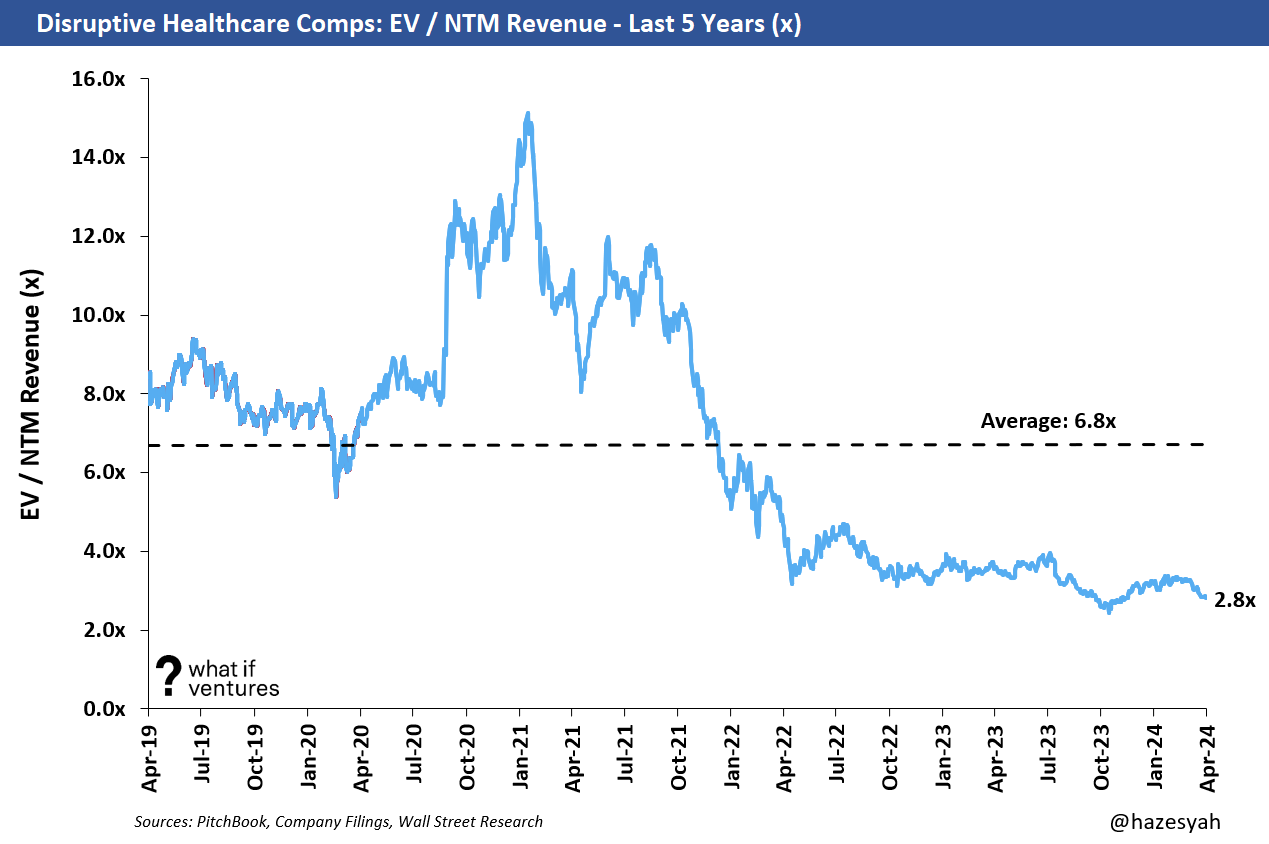
Valuation — EV / NTM Revenue:
Mature healthcare comps are generally valued based on their earnings (see the broader comps at the bottom of this post). However, earlier stage businesses such as startups, and to an extent these younger, disruptive healthcare public companies often don’t have positive earnings yet or they may have positive earnings, but they haven’t reached the margin profile they will achieve upon maturity as a business. As a result, it’s harder to compare these companies on an apples-to-apples basis using EV to earnings. So, we use EV/NTM revenue to triangulate valuation for these companies and for startups in similar markets.
Summary of EV / NTM Revenue Valuation Stats:
5 Year Average: 6.8x
Today: 2.8x
Peak: 15.1x
Trough: 2.4x
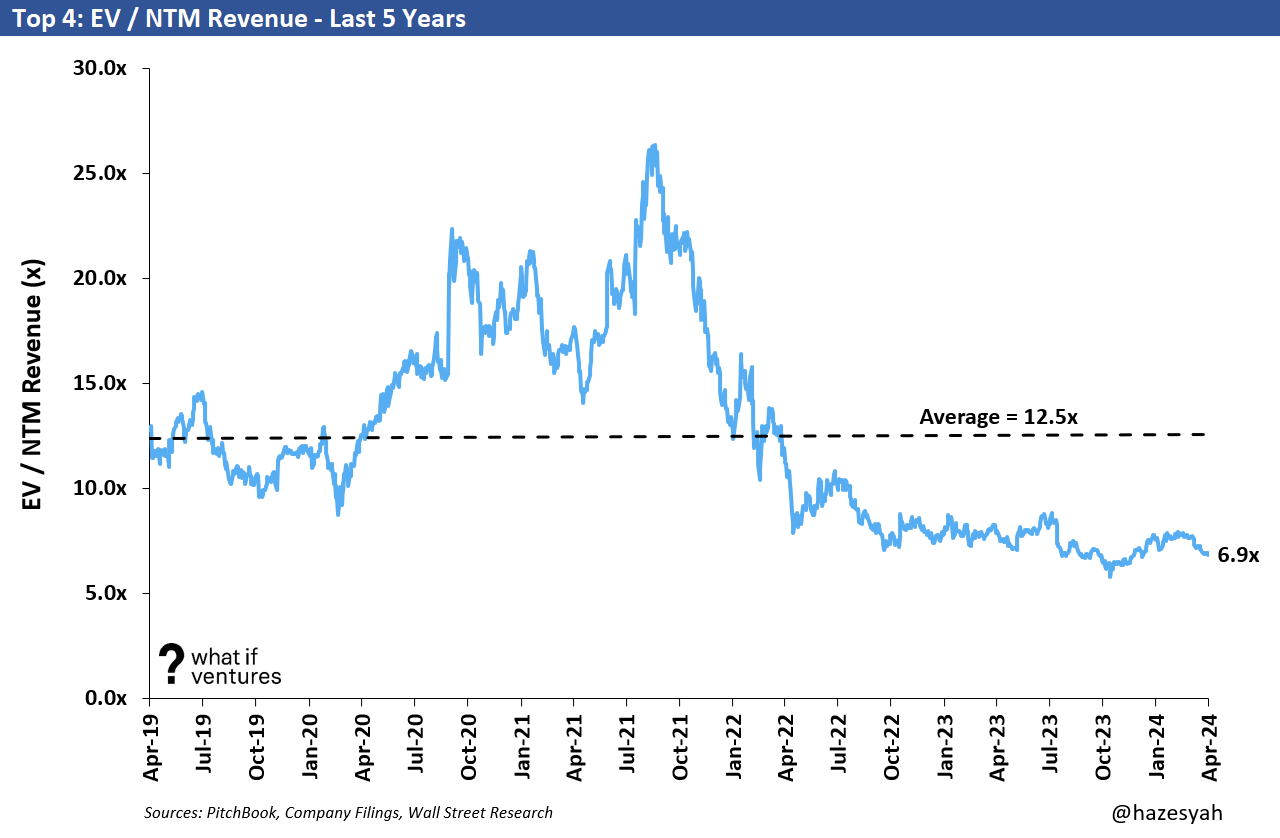
Summary of top 4 EV / NTM Revenue Valuation Stats:
5 Year Average: 12.5x
Today: 6.9x
Peak: 26.4x
Trough: 5.8x
Valuation — EV / NTM EBITDA:
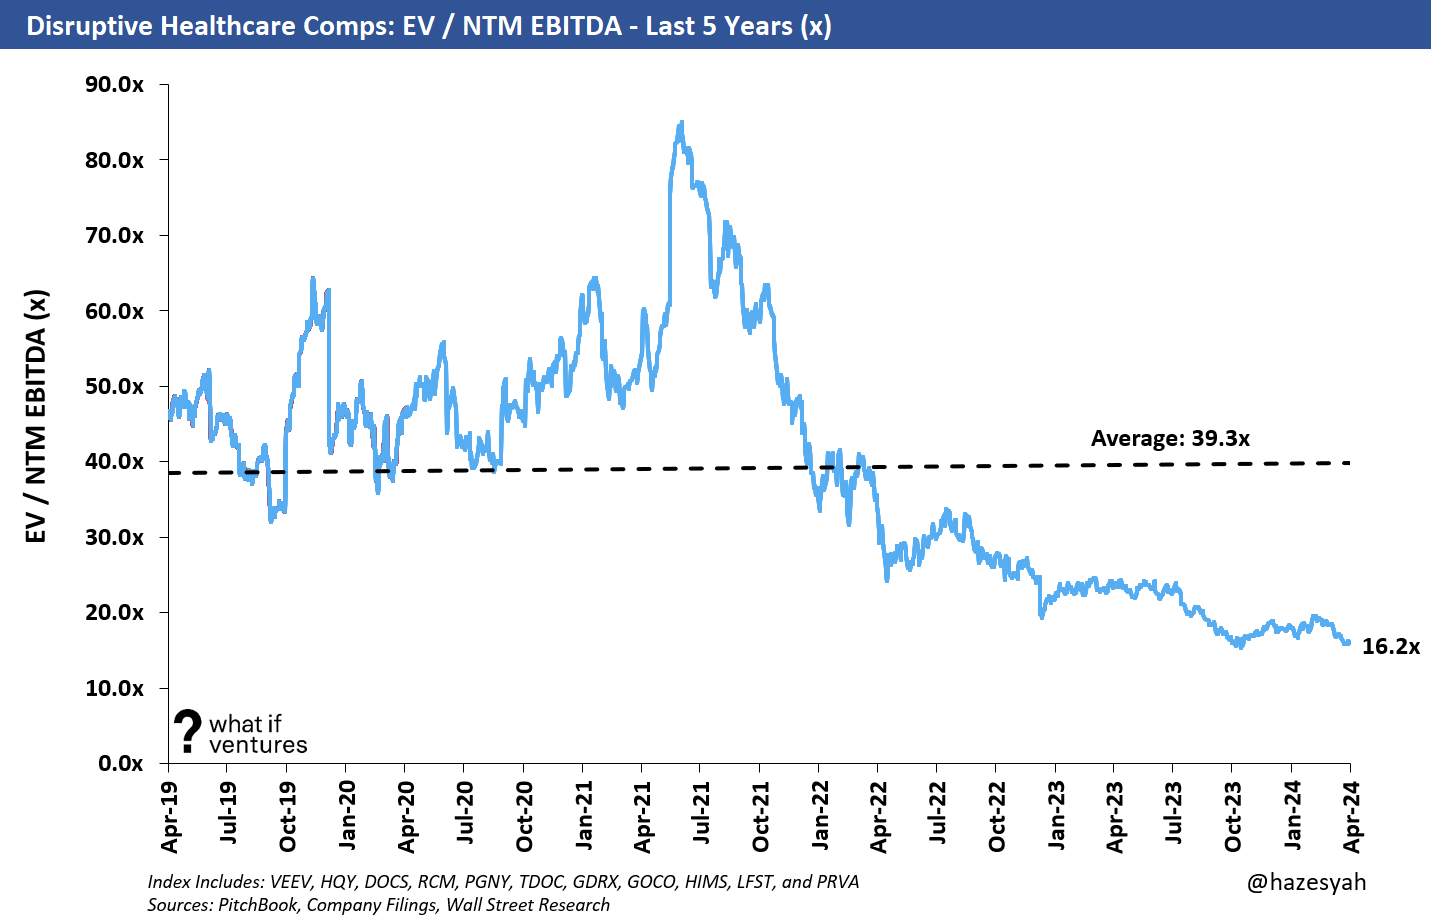
We were previously only looking at 8 companies from the perspective of EV/NTM EBITDA, but since Q1 earnings have reported, more analysts are projecting positive EBITDA in 2024 and beyond for more of the peers so we have expanded the index here to include 11 of the 16 companies.
To create an index, I only include the peers who have a substantial believable positive NTM EBITDA forecast based on the average of Wall Street equity research reports. The comps with barely positive EBITDA yield EBITDA multiples that aren’t realistic (so we consider them not meaningful “NM”).
The included companies are: VEEV, HQY, DOCS, RCM, PGNY, TDOC, GDRX, GOCO, HIMS, LFST, and PRVA. That’s not to say the other Companies won’t have positive EBITDA in 2024, but the multiples are relevant right now. Here’s how the chart looks.
Summary EV / NTM EBITDA Valuation Stats:
5 Year Average: 39.3x
Today: 16.2x
Peak: 85.0x
Trough: 15.3x
As these companies mature and begin to trade on EBITDA multiples or even P/E multiples (much like the hospital facilities and MCO peers) then this chart will tell us more. This is certainly a data point we can look at for profitable growth equity stage private companies. I’d expect those companies to be valued closer to the 5-year average or slightly lower. Some of that data in 2019 and 2020 is elevated because the EBITDA estimates back then were very small or barely positive for some of these companies driving an artificially high multiple that wasn’t driving valuation but rather was a dependent variable.
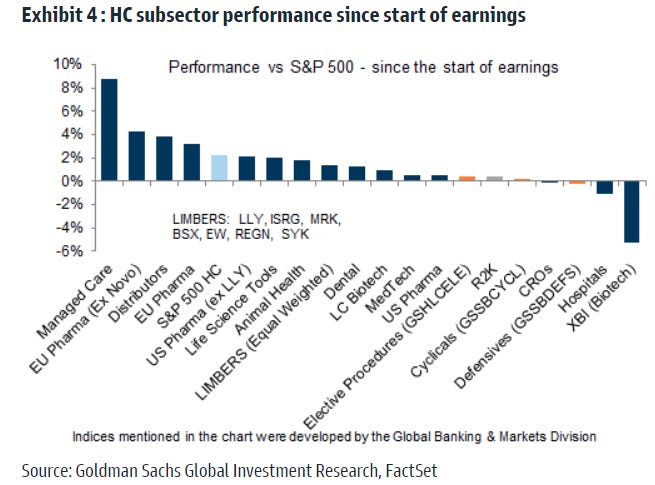
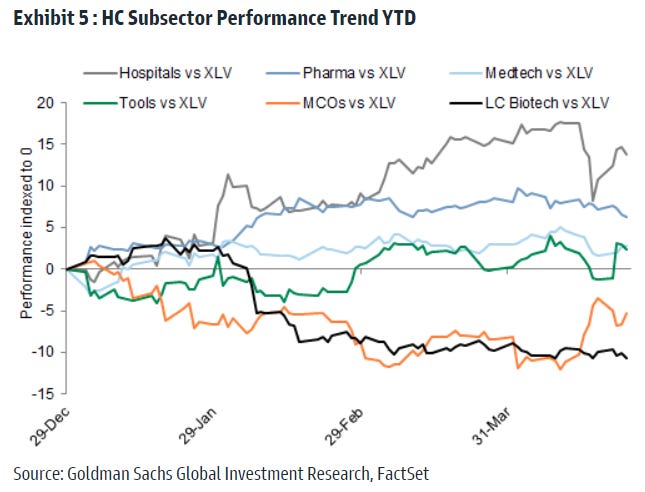
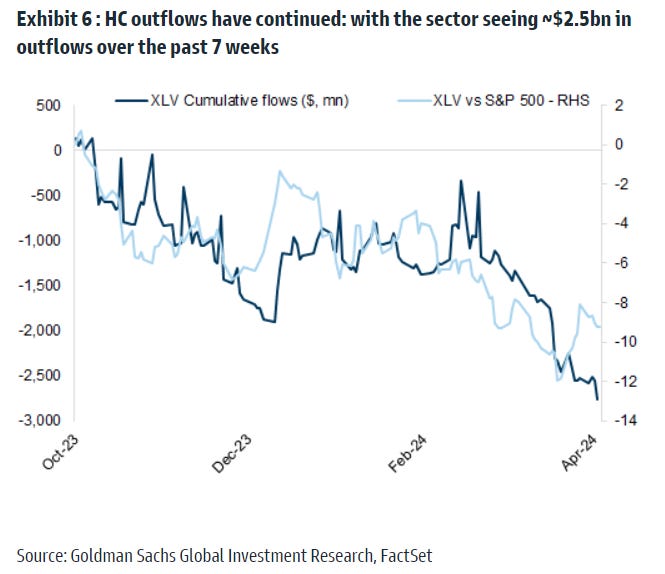
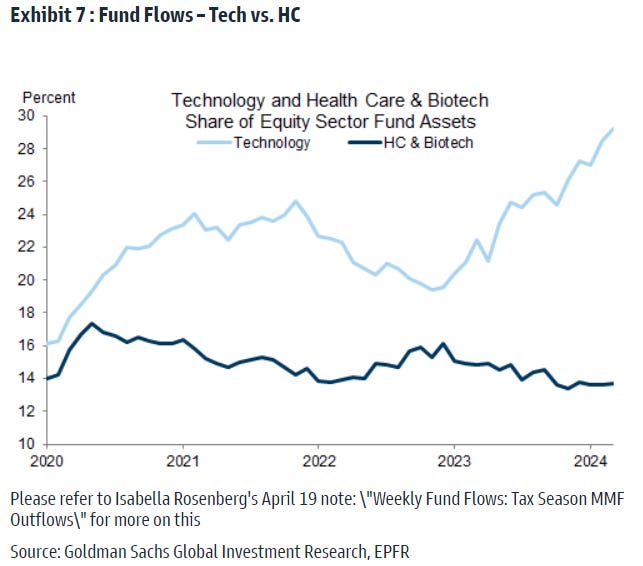
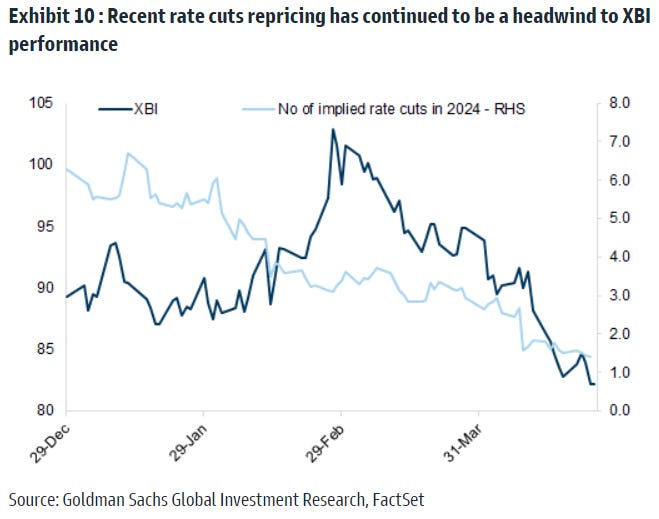
More Healthcare Charts:
Here are a handful of charts that caught my eye in various research reports this week. I hope this information is helpful.

Broader Healthcare Comps as of 4/26/2024:
This newsletter is mostly focused on the disruptive healthcare comps and how their performance drives valuation for our private market portfolio at What If Ventures. However, we do keep a much broader set of comps that includes Healthcare Facilities and Managed Care Organizations.
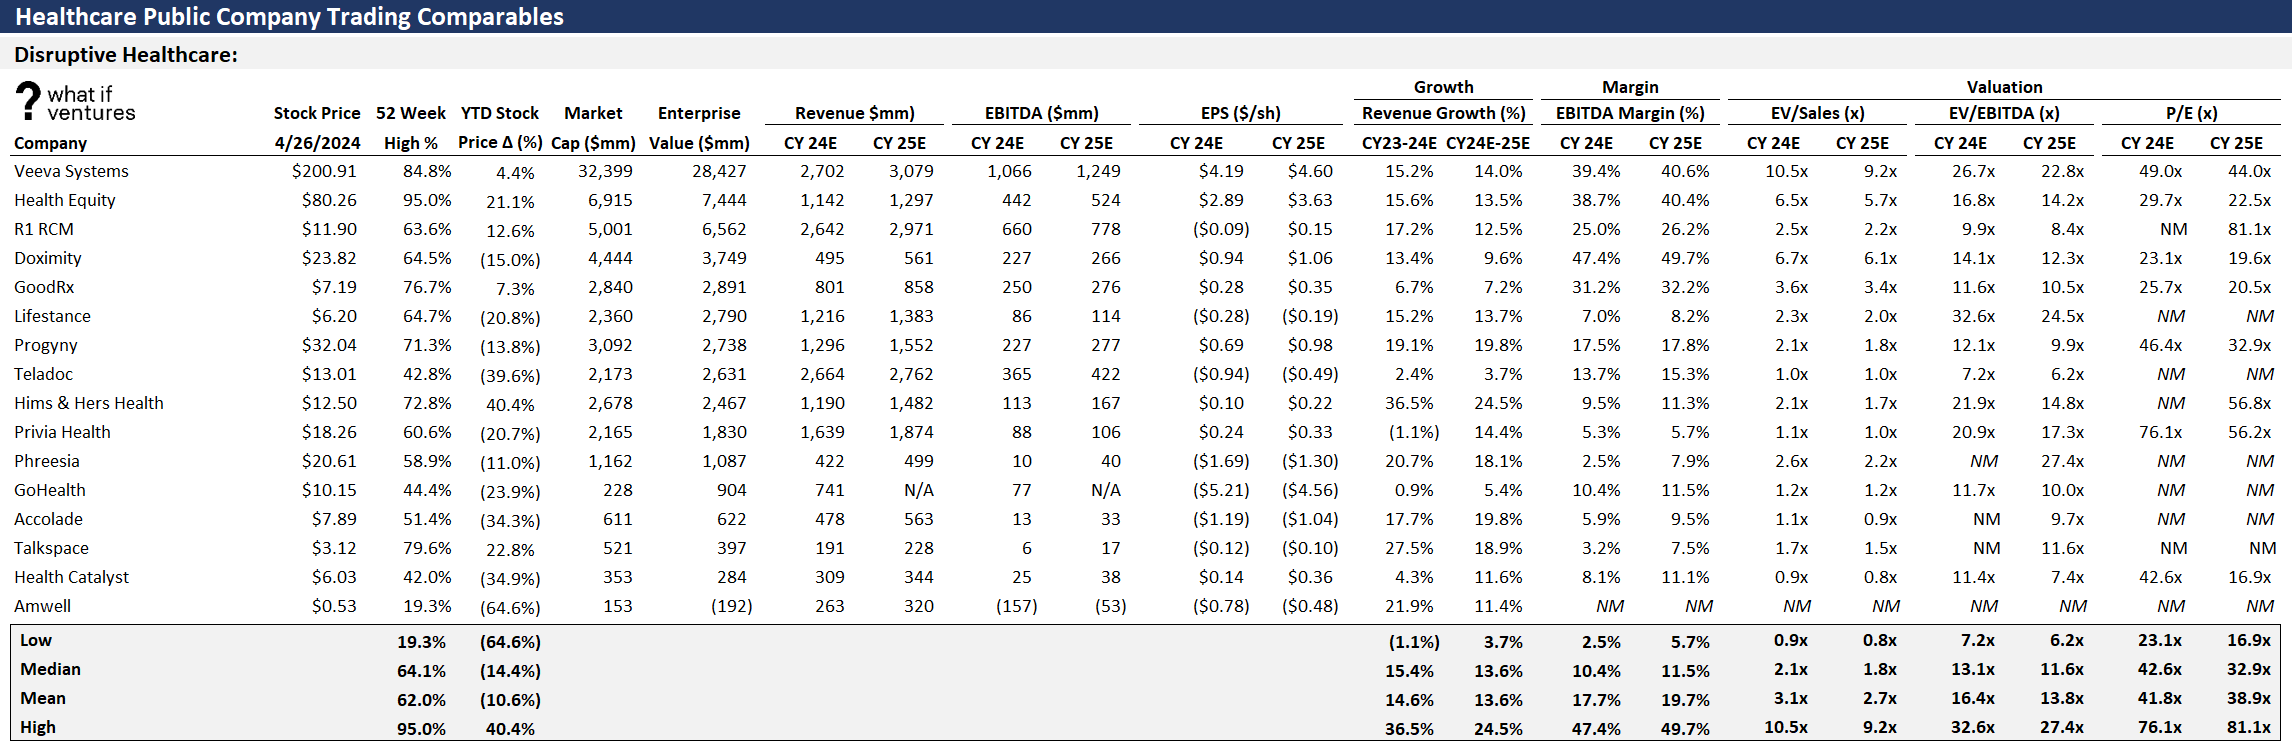
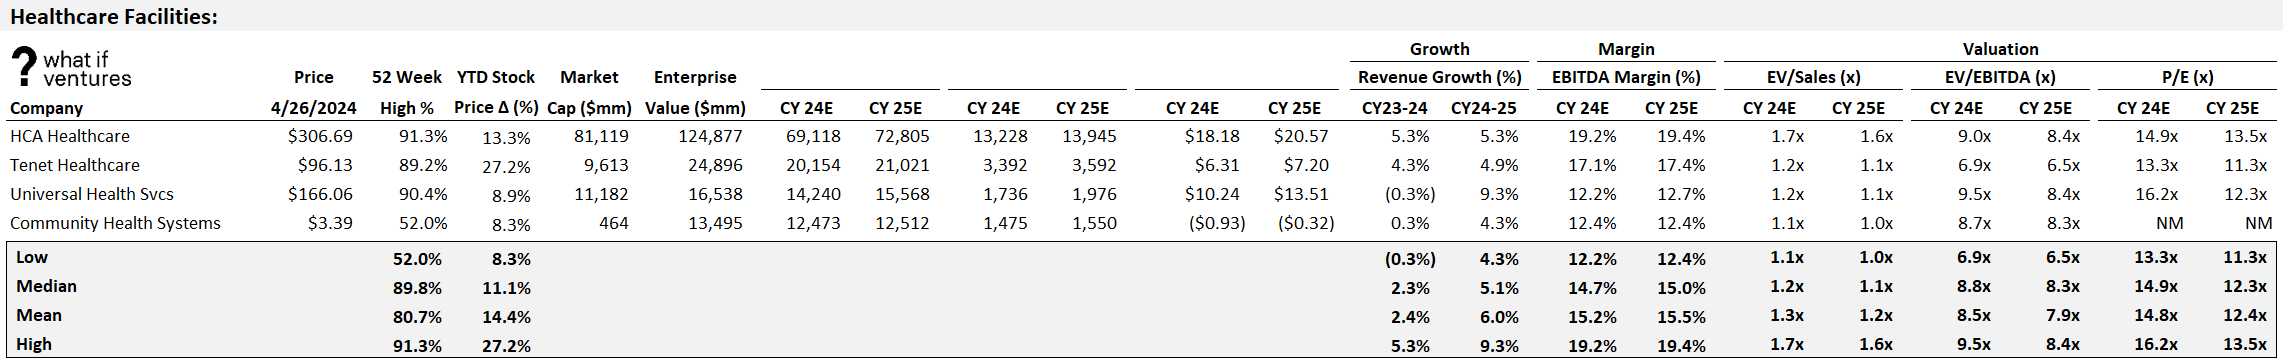
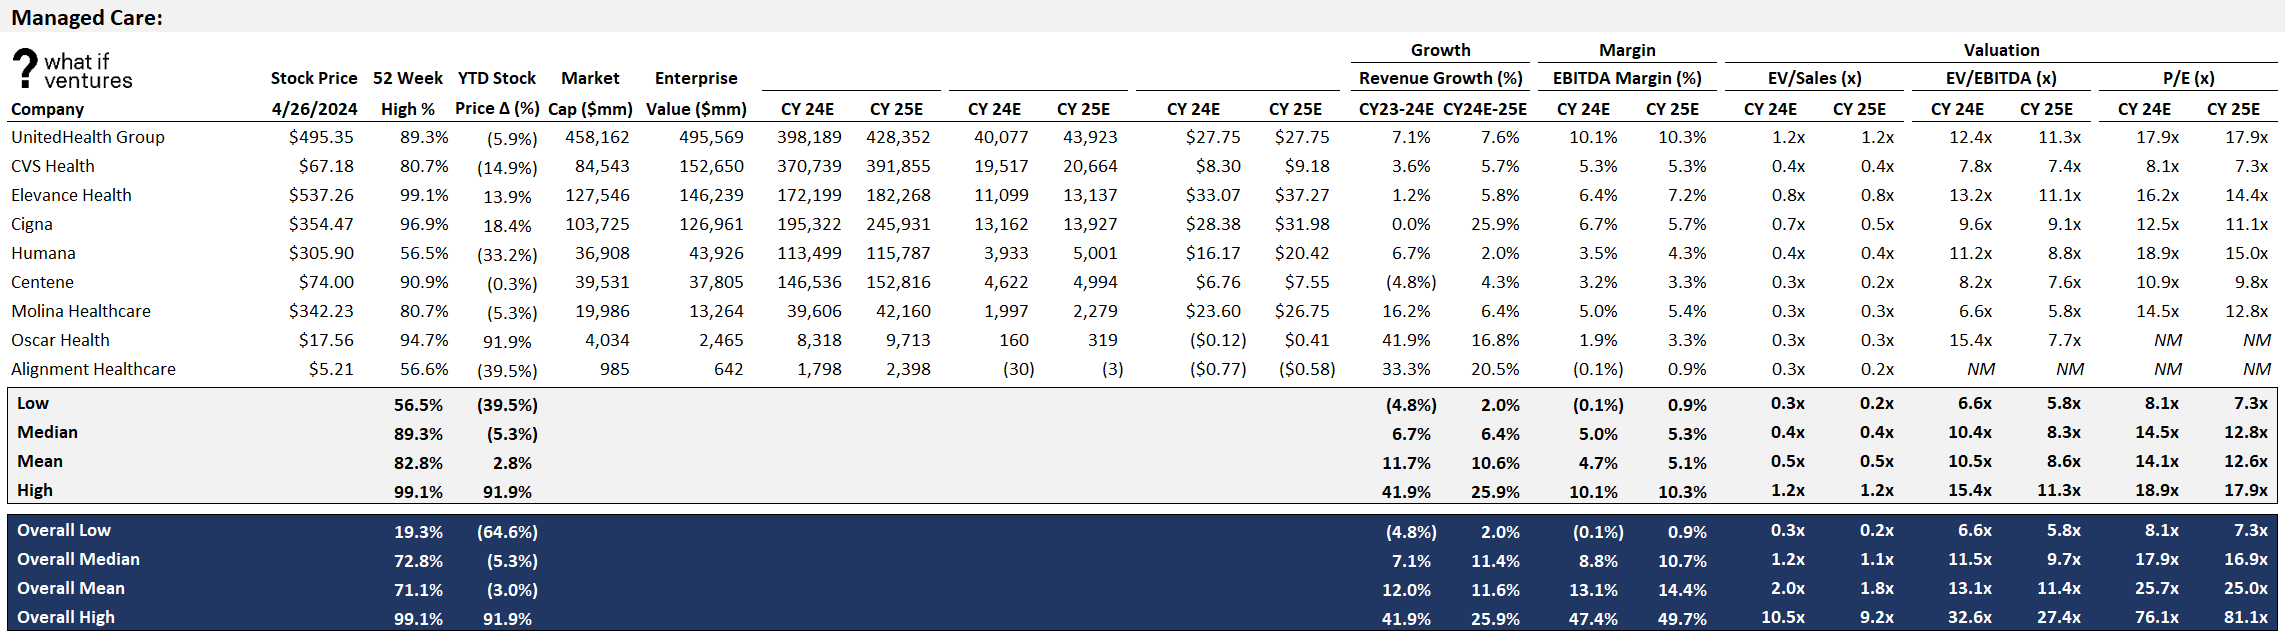
^I realize this is too small to read, but if you double click on the image it should expand. Or you can just email me and I’ll send you the backup.
If you would like to receive weekly updates on this data and our outlook on the Disruptive Healthcare market, then please subscribe and share our work with a friend.
What If Fellowship: Demo Day 5/17/2024
The What If Ventures Fellowship program is about to graduate our 10th cohort of startups. These founders spent the last couple of months working with us on perfecting their business models and pitches. These startups come from all areas of the healthcare world, with a heavy emphasis on mental health. The culminating event of our program is a demo day via Zoom which will take place on Friday, May 17th and Noon ET.
I’d love for you to join if you’d like to come support the startup community and see what our latest batch of 21 founders are up to. Sign-up to attend demo day via this link: Demo Day Attendee Registration Form.
About What If Ventures — What If Ventures invests in mental health and digital health startups from seed stage to growth equity. To date, we have invested over $83mm into 72 healthcare startups since January 2020.
If you have questions about any of this analysis or want to collaborate with What If Ventures, please reach out via info@whatif.vc. We’d love to connect with entrepreneurs and investors in the space.
You can follow more of my commentary on twitter here: @hazesyah