


Disruptive Healthcare 2/16/2024: Shake It Off

Disruptive healthcare valuation, trends and analysis weekly. Always free. Subscribe:
Shake It Off:
On Tuesday it seemed as if a spike in interest rates would drag the market down for the week as equities pulled back broadly. However, the broader markets and specifically our disruptive healthcare peers made like Taylor and shook it off for the most part by the end of the week.
A surprisingly high inflation readout led markets to believe fed rate cuts are further out into the future than many people had hoped. This led interest rates to spike in the market driving equity prices down on Tuesday (see chart below).
The most impressive thing I see in the data this week is that while interest rates did spike, the peers traded up since mid-week breaking from their recent correlation to interest rates. I’m curious to see how this plays out next week.
You can see this action in our weekly stock price graph here:
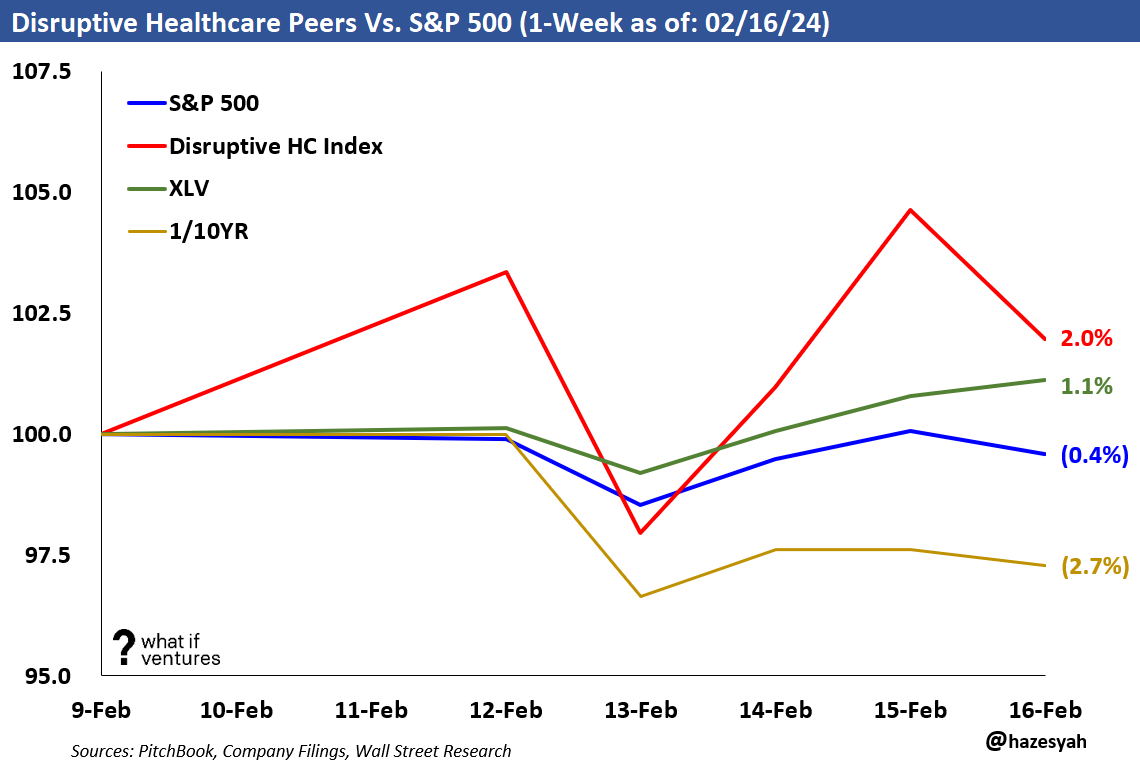
The big drop in the yellow line is the spike in interest rates. Keep in mind, we graph the “inverse” of interest rate movements to show correlation visually with our peer group (see more charts below to see it over time).
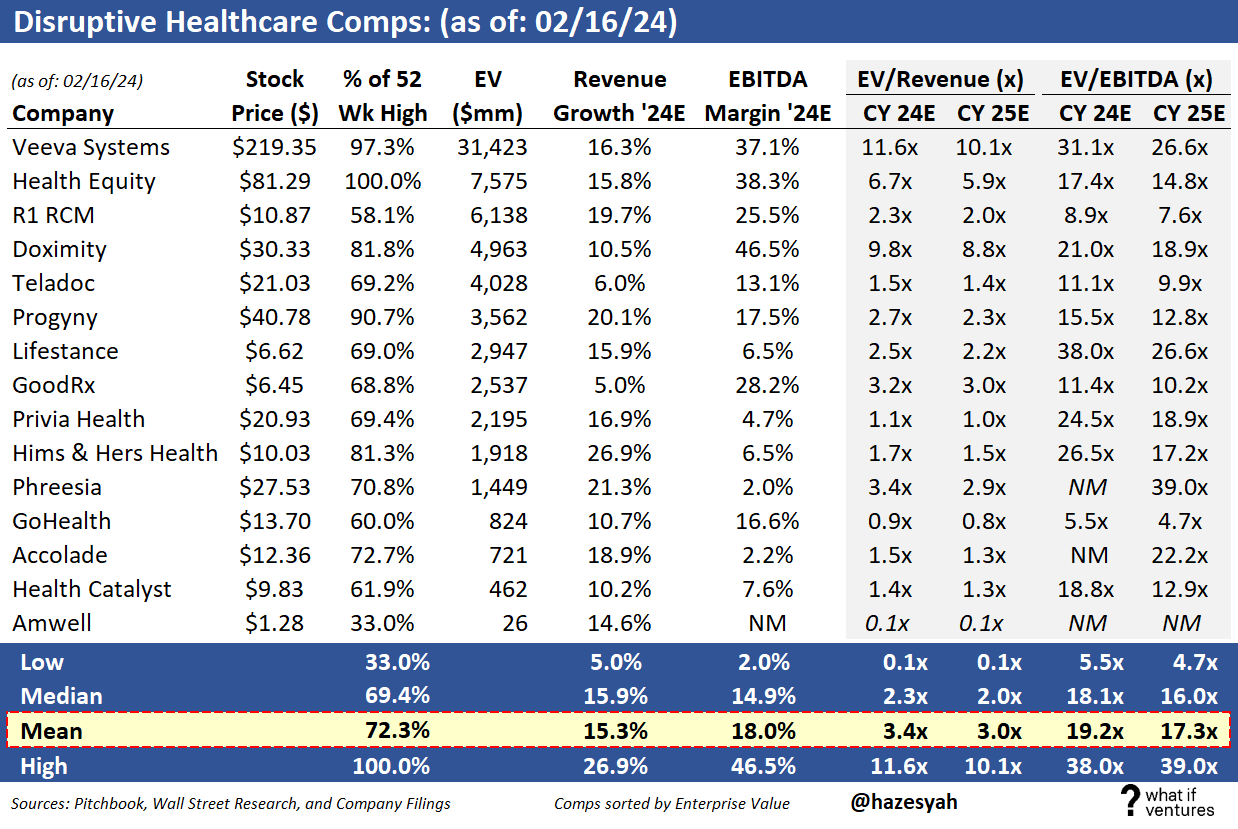
Disruptive Healthcare Public Comps:
Top 5 Revenue Multiples:
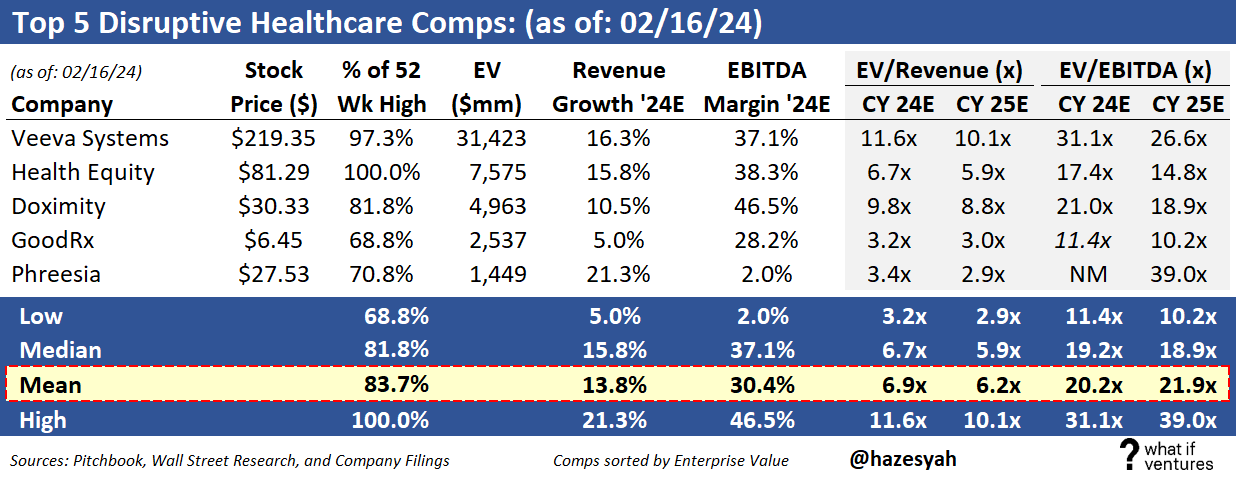
This group is a subset of the broader disruptive healthcare peer set. These 5 currently have the largest EV / 2024 Revenue multiple. This group trades at 6.9x 2024E revenue versus the broader group at 3.4x. If you take a look at our post from last week, you’ll also notice that this top 5 group saw multiples expand this week while the broader group in the table above saw multiples decline slightly this week.
Comps Weekly Share Price Performance:
Disruptive healthcare companies had a good week in the stock market this week relative to the S&P 500. Our peers were up an average of 2.0% while the S&P moved down 0.4%.

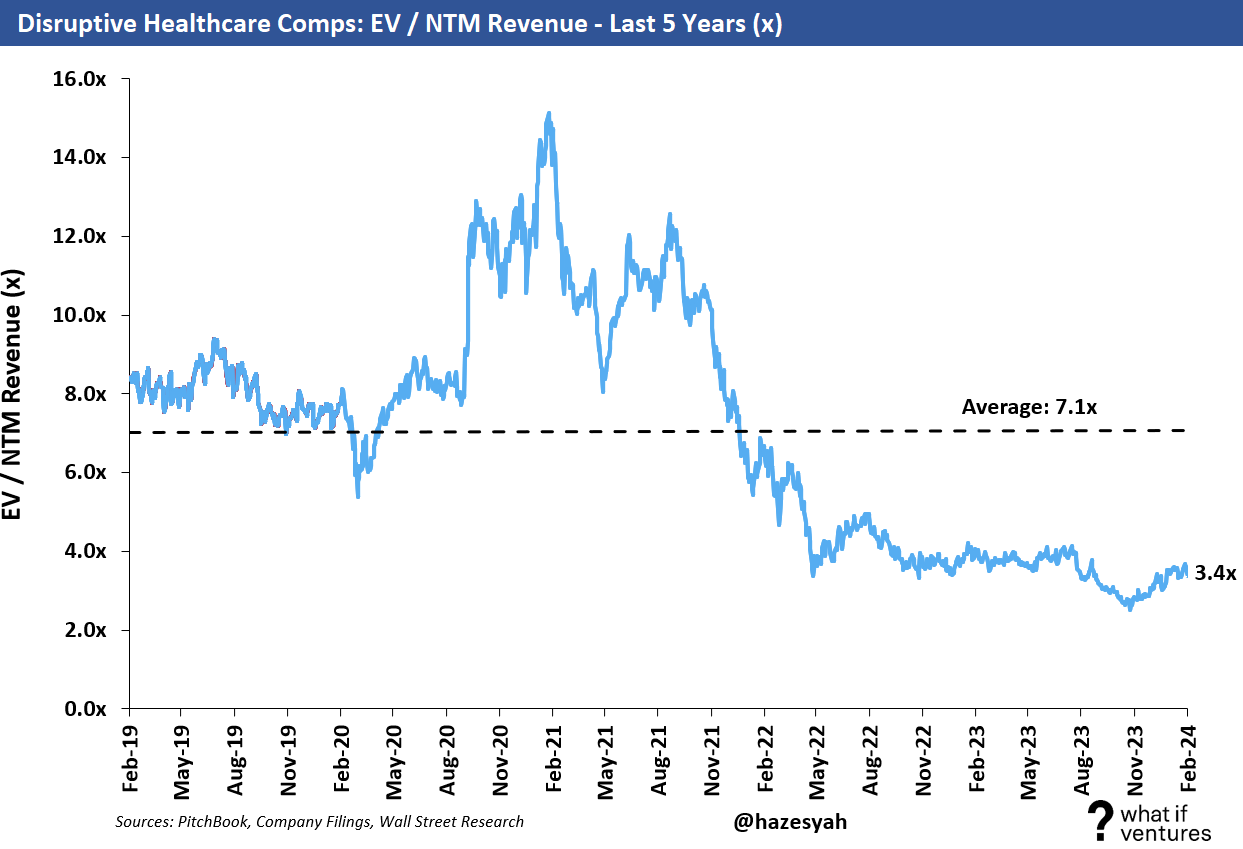
Valuation — EV / NTM Revenue:
Mature healthcare comps are generally valued based on their earnings (see the broader comps at the bottom of this post). However, earlier stage businesses such as startups, and to an extent these younger, disruptive healthcare public companies often don’t have positive earnings yet or they may have positive earnings, but they haven’t reached the margin profile they will achieve upon maturity as a business. As a result, it’s harder to compare these companies on an apples-to-apples basis using EV to earnings. So, we use EV/NTM revenue to triangulate valuation for these companies and for startups in similar markets.
Summary EV / NTM Revenue Valuation Stats:
5 Year Average: 7.1x
Today: 3.4x
Peak: 15.1x
Trough: 2.5x

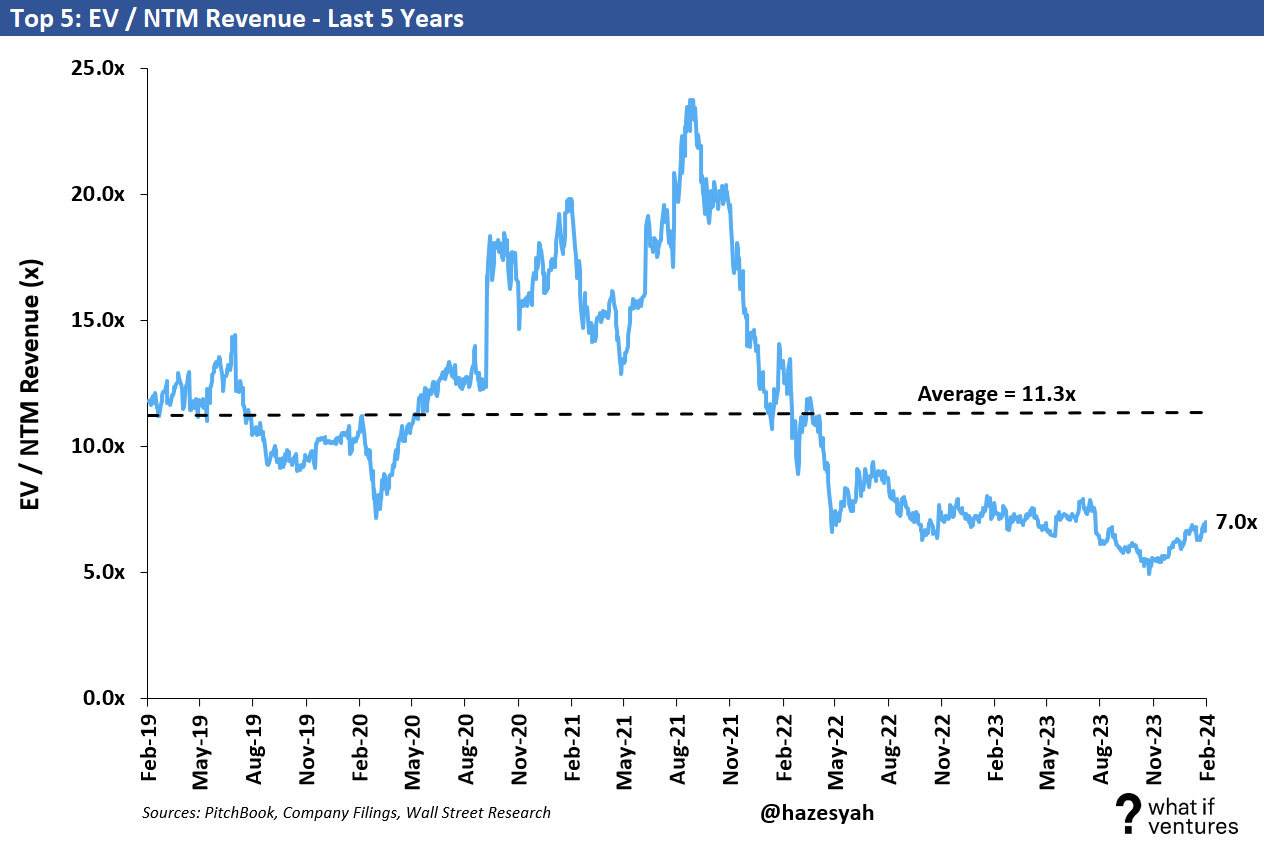
Summary of top 5 EV / NTM Revenue Valuation Stats:
Top 5 companies include VEEV, HQY, GDRX, and PHR as of today.
5 Year Average: 11.3x
Today: 7.0x
Peak: 23.7x
Trough: 4.9x
Valuation — EV / NTM EBITDA:
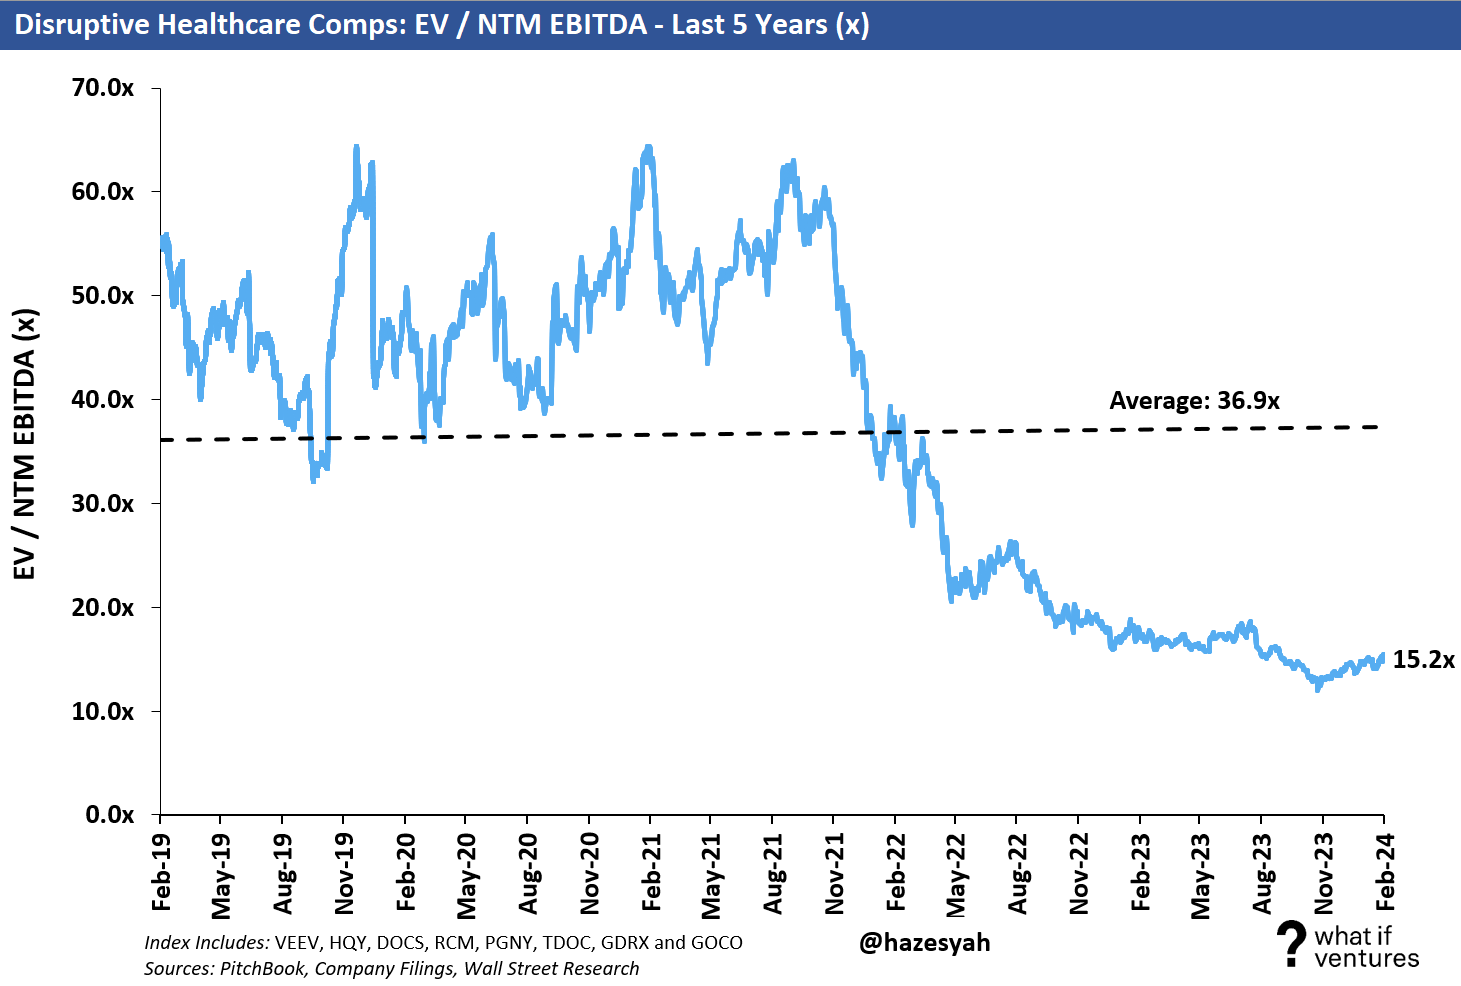
It’s a little bit harder to value the earlier cycle businesses on an EV / NTM EBITDA, but it’s worth considering the data point. Only 8 of these 15 companies have positive NTM EBITDA projections right now, or barely positive EBITDA. The ones with barely positive EBITDA yield EBITDA multiples that aren’t realistic (so we consider them not meaningful “NM”). To create an index, I only include the peers who have a substantial believable positive EBITDA forecast for 2024 based on the average of Wall Street equity research reports. Those companies include: VEEV, HQY, DOCS, RCM, PGNY, TDOC, GDRX and GOCO. That’s not to say the other Companies won’t have positive EBITDA in 2024, but the multiples are relevant right now. Here’s how the chart looks.
Summary EV / NTM EBITDA Valuation Stats:
5 Year Average: 36.9x
Today: 15.2x
Peak: 64.4x
Trough: 12.0x
As these companies mature and begin to trade on EBITDA multiples or even P/E multiples (much like the hospital facilities and MCO peers) then this chart will tell us more. This is certainly a data point we can look at for profitable growth equity stage private companies. I’d expect those companies to be valued closer to the 5-year average or slightly lower. Some of that data in 2019 and 2020 is elevated because the EBITDA estimates back then were very small or barely positive for some of these companies driving an artificially high multiple that wasn’t driving valuation but rather was a dependent variable.
Stock Price Trends:
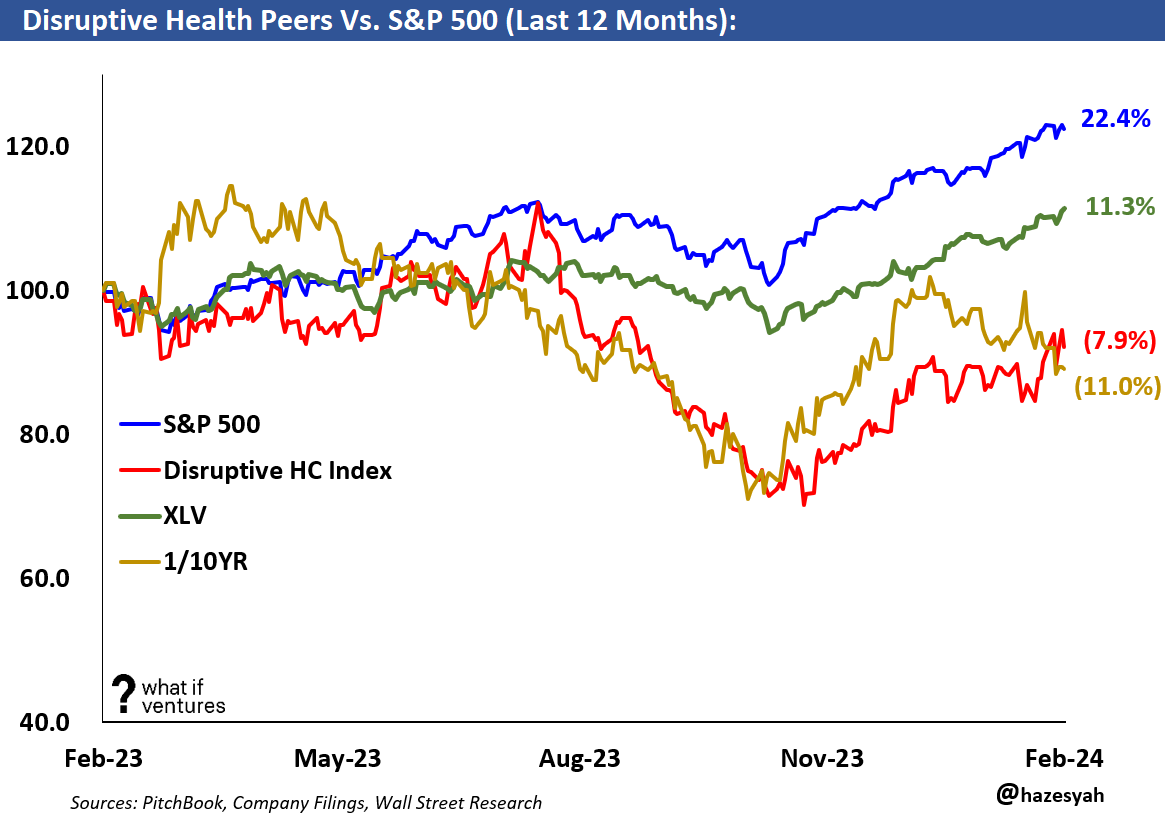
This week we have added the inverse 10 Year Treasury rate change to the long-dated charts. There is a very strong correlation between interest rates and the stock price performance of earlier stage companies over time.
In the stock price charts below we compare the Disruptive Healthcare peers to the S&P 500, the XLV and the inverse of the 10 Year Treasury rate over various time horizons. For those that aren’t familiar, the XLV is the S&P500 healthcare ETF which includes a wide mix of companies in the health care equipment and supplies, health care providers and services, biotechnology, and pharmaceuticals industries. Some companies in the XLV include Johnson & Johnson, Pfizer, UnitedHealth, AbbVie and Eli Lilly and their peers.
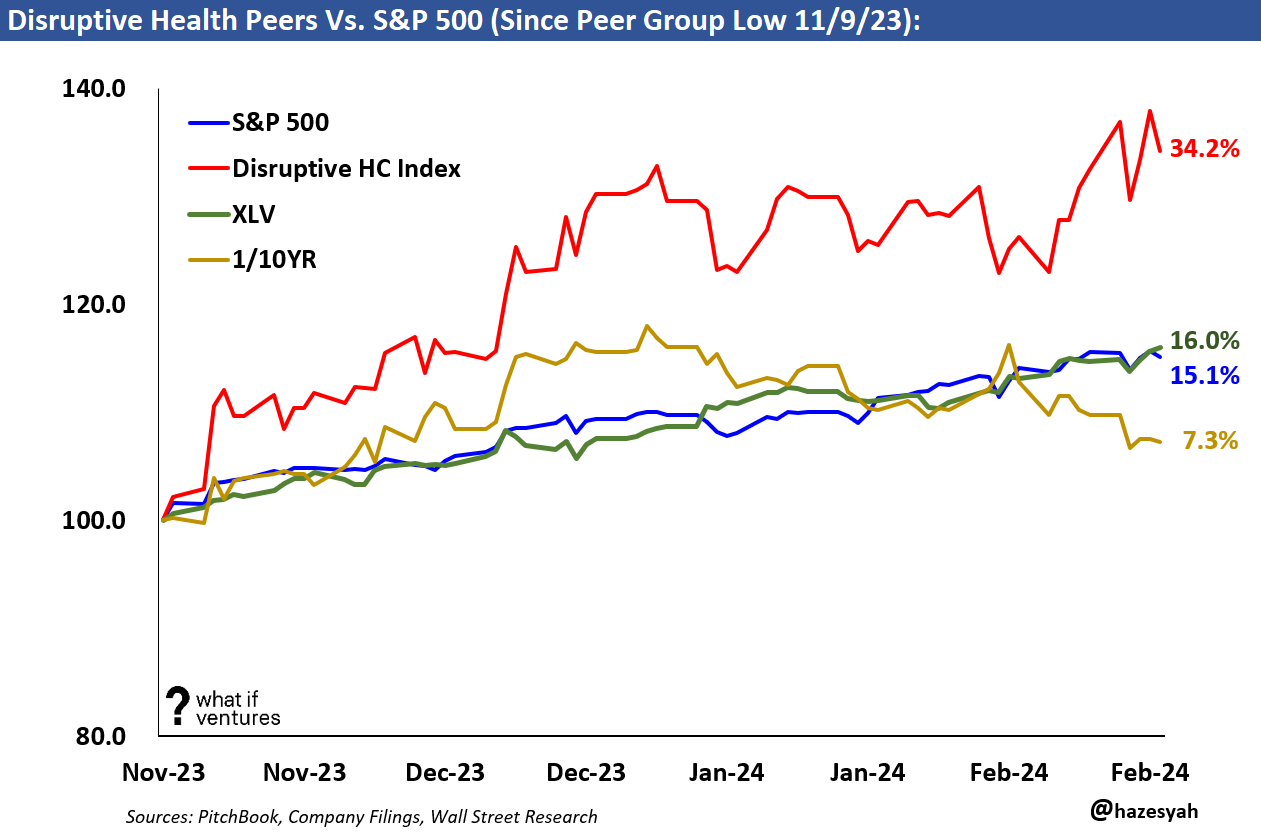
I’ve mentioned this in prior weeks, but our disruptive healthcare peers seem to have bottomed as a group on November 9th, 2023. Since that time, they have drastically outperformed the broader market. We believe this is because of a broader rotation of capital back into the healthcare space after a couple years of an over correction in the other way. We are seeing similar flows in the private market deals we are participating in right now as well.
Broader Healthcare Comps Set as of 2/16/2024:
This newsletter is mostly focused on the disruptive healthcare comps and how their performance drives valuation for our private market portfolio at What If Ventures. However, we do keep a much broader set of comps that includes Healthcare Facilities and Managed Care Organizations. I know the font is small, but you should be able to click on these and expand.
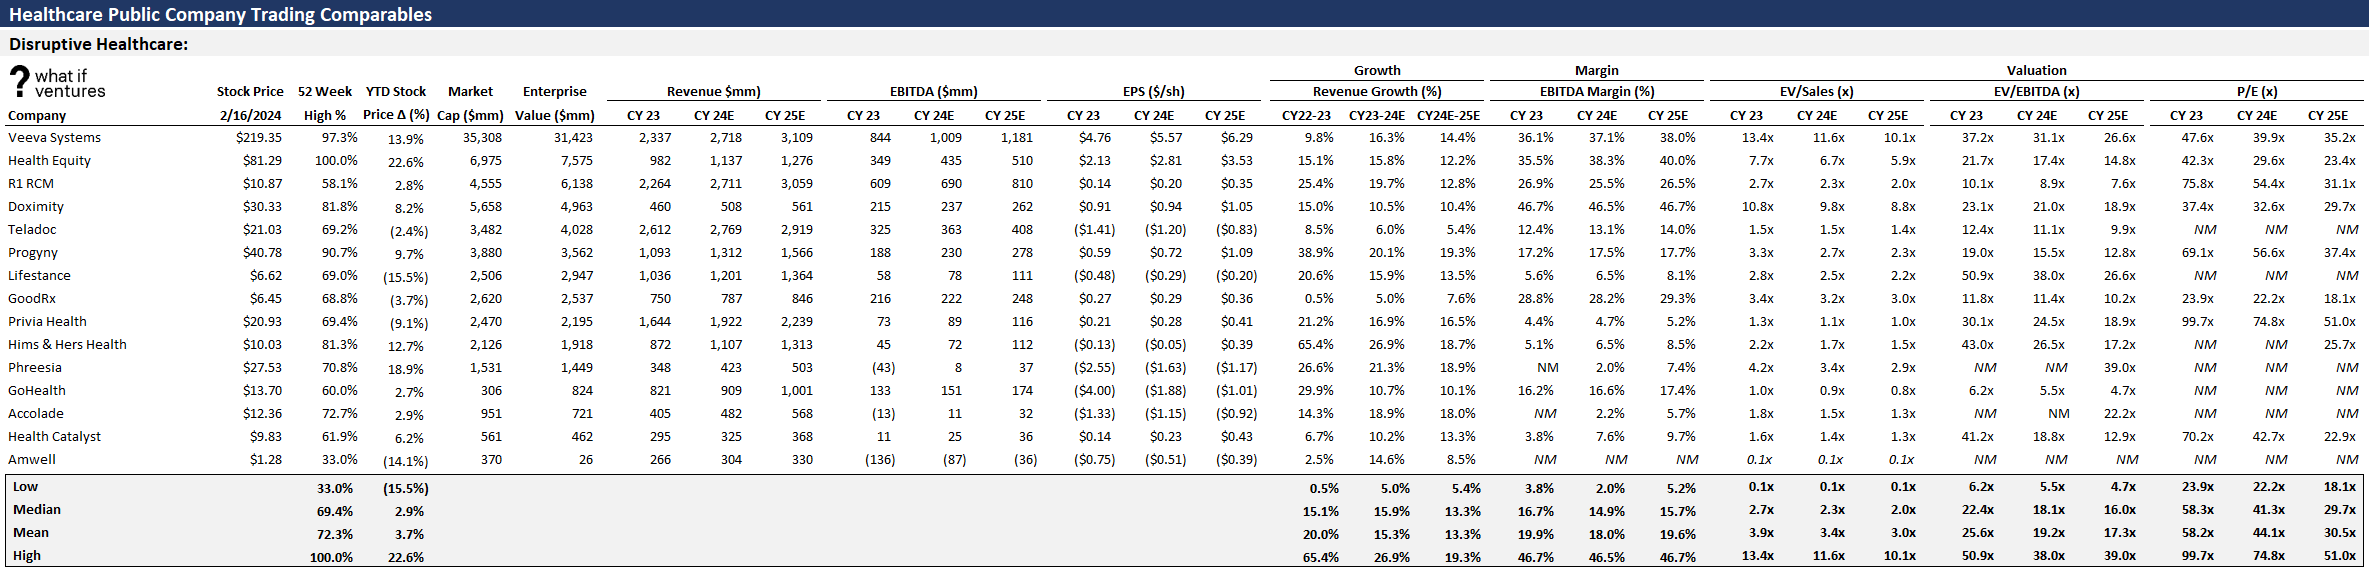
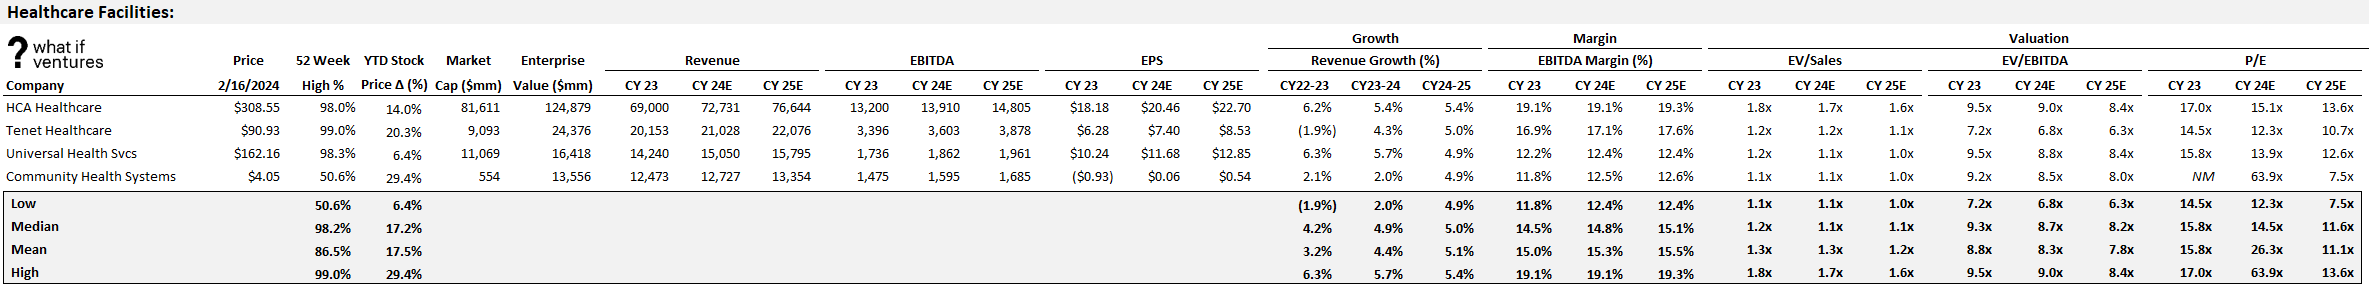
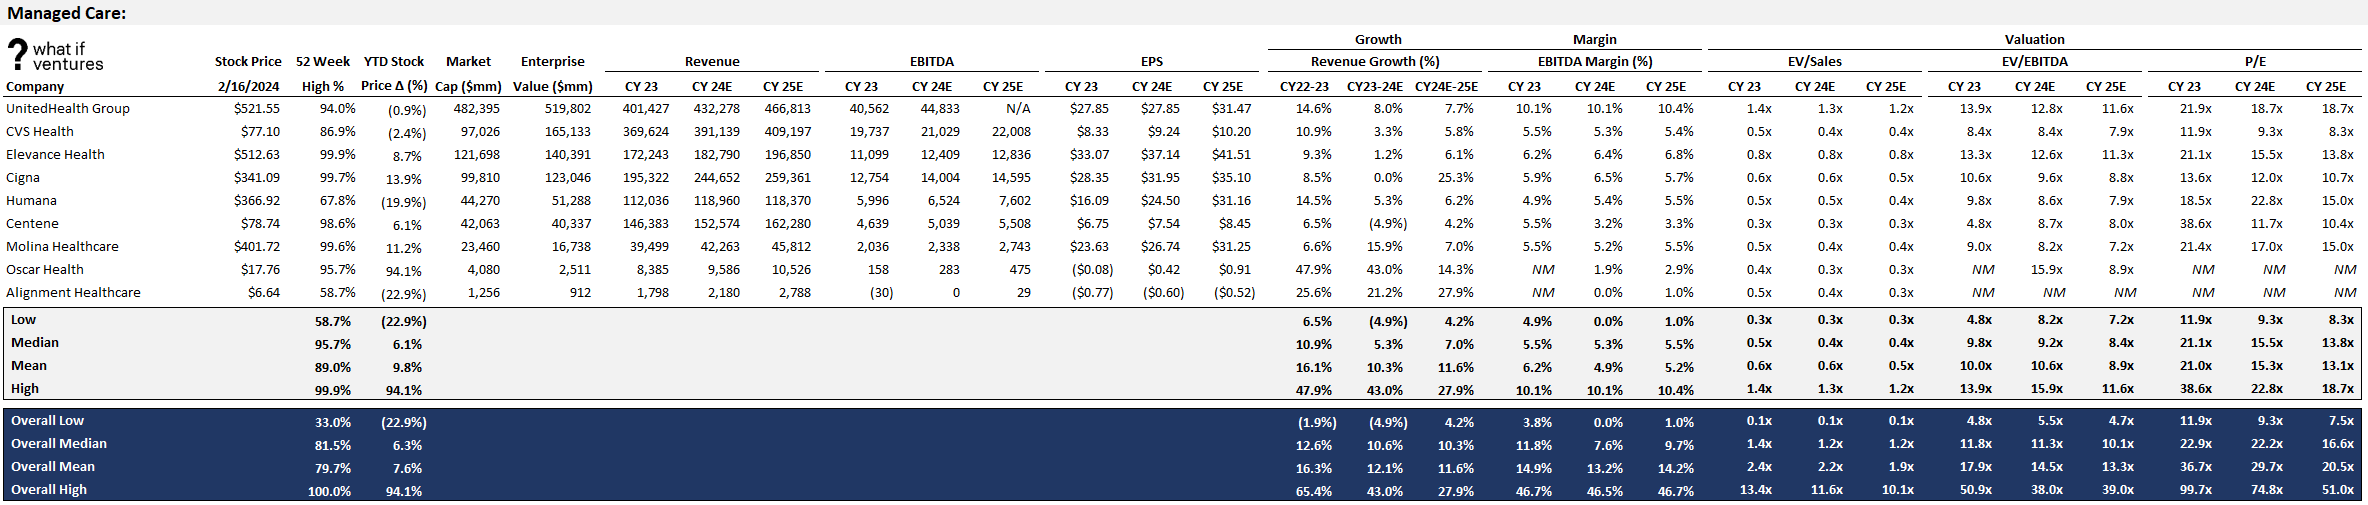
^I realized this is too small to read, but if you double click on the image it should expand.
I hope this is helpful!
What’s Missing?
What else would you like to see in our weekly data? Please comment and let us know.
If you would like to receive weekly updates on this data and our outlook on the Disruptive Healthcare market, then please subscribe and share our work with a friend.
About What If Ventures — What If Ventures invests in mental health and digital health startups from seed stage to growth equity. To date, we have invested over $82mm into 70 healthcare startups since January 2020.
If you have questions about any of this analysis or want to collaborate with What If Ventures, please reach out via info@whatif.vc. We’d love to connect with entrepreneurs and investors in the space.
You can follow more of my commentary on twitter here: @hazesyah