


Disruptive Healthcare 12/20/2024 - Healthcare Worst Sector of 2024
It has been painful. Very painful. Will it end? Tons of charts for context below.

Disruptive healthcare valuation, trends and analysis.
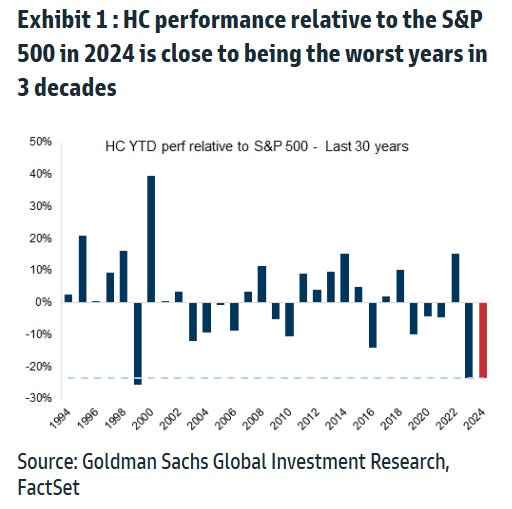
According to a recent Goldman Sachs Healthcare sector report:
“HC was the worst performing of all S&P 500 sectors in 2024, lagging for a second year in a row (and in 5 of the 6 years, with XLV/SPX performance now approaching 2008 lows…”
In that same report, Goldman provided quite a few charts to give context to how poorly healthcare has performed as a sector this year. I’m sharing some of the most helpful charts from that report here.
You know what they say, a picture is worth a thousand words. Here are some ugly pictures…


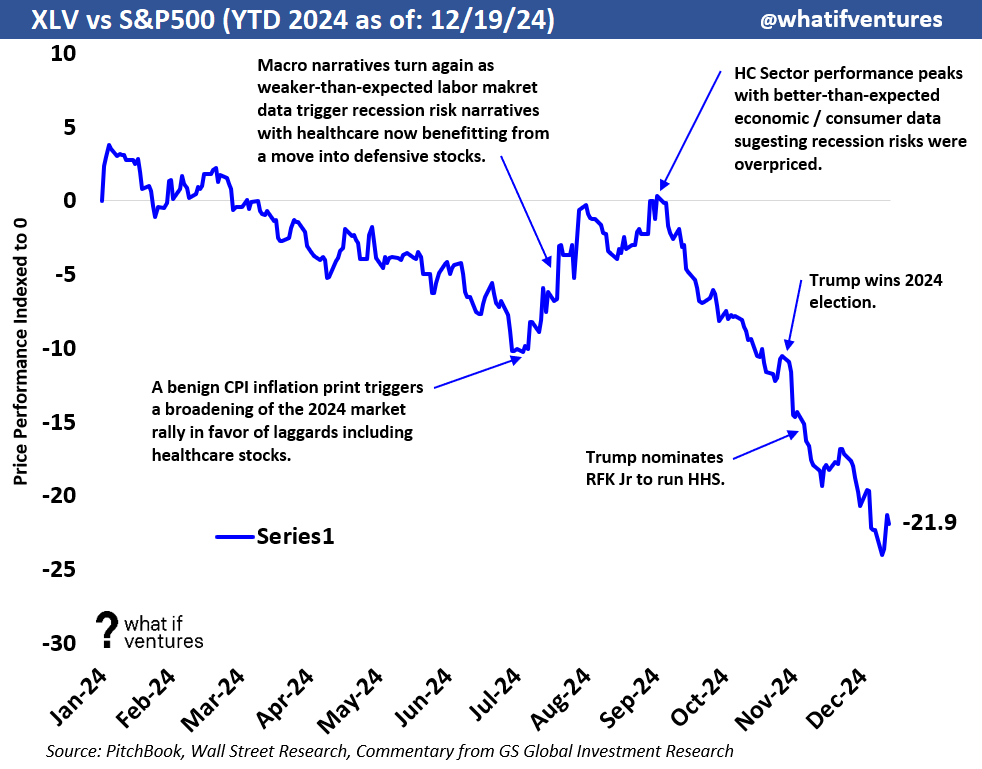
The chart below takes the daily performance differences of the XLV and the S&P 500 then indexes that difference daily. This index shows the relative strength of the XLV versus the broader market and you can see that Healthcare has traded worse than the broader market for most of the year with a significant underperformance since the end of summer. Today, that index sits at a negative differential of 21.9 as shown in the chart below. Twice as low as it was the day after the election.
If I’m a Startup or a VC - So what?
How does all of this translate to our business? Eventually, there will be a bottom. We won’t know it was the bottom for sure, until we are out of that bottom. I believe we are close. It could get worse before it gets better. However, I’m going to continue to invest in innovation in this space. Why? Healthcare is a massive market, that is heavily regulated and has seen little effective innovation outside of new drug development because of the structural inefficiencies in this massive market. As such, innovation that actually works will generate huge winners.
At the same time, buying low and selling high has always been a winning strategy in the investing business. I want to deploy more capital, here near the bottom, before valuations run away and get frothy again.
With all of these thoughts in mind - I’m very LONG disruptive healthcare at the moment. And will increasingly take more long exposure in private and public markets.
Let's take a closer look at how our Disruptive Healthcare peers are doing lately…
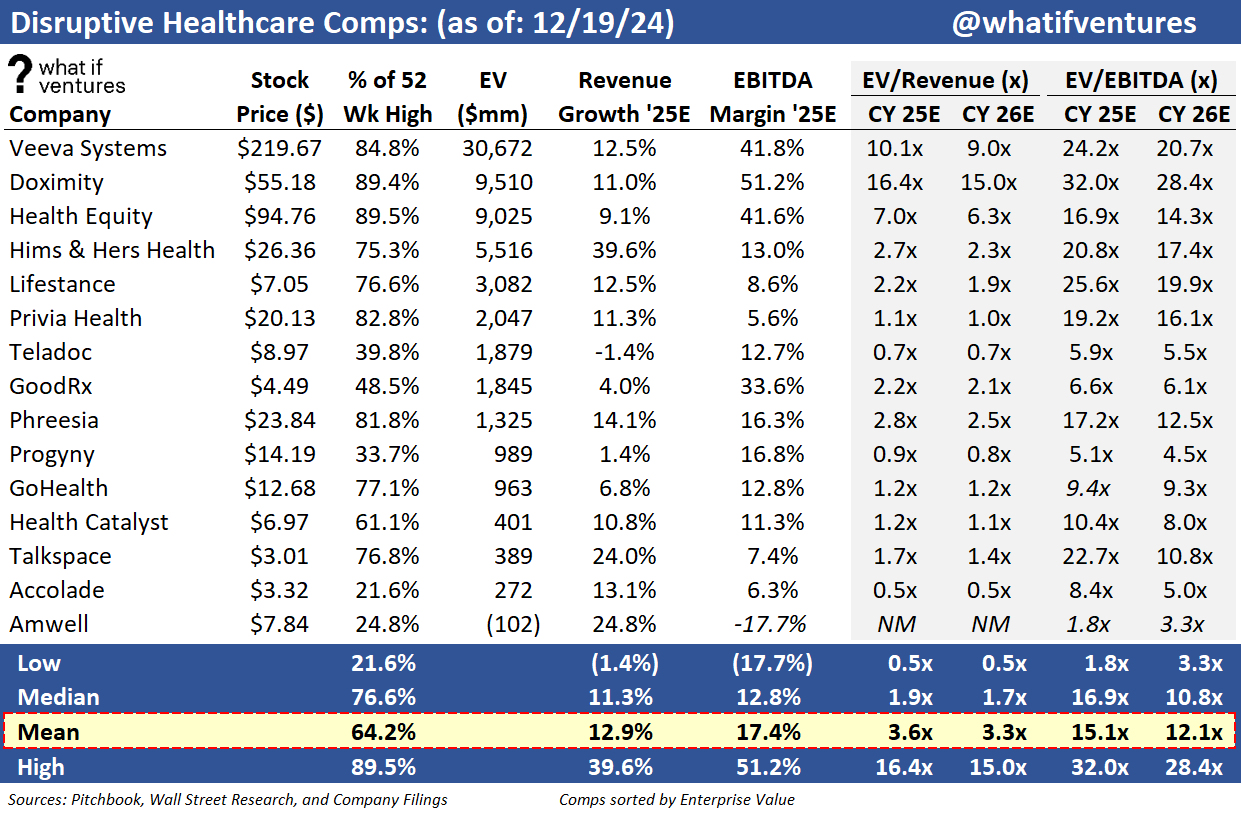
Disruptive Healthcare Public Comps:
Turning to valuation, we’ve seen an improvement in NTM revenue multiples lately for our peers. Our Disruptive Healthcare peer group is currently trading at 3.76x 2025E revenue and 3.3x 2026E revenue.
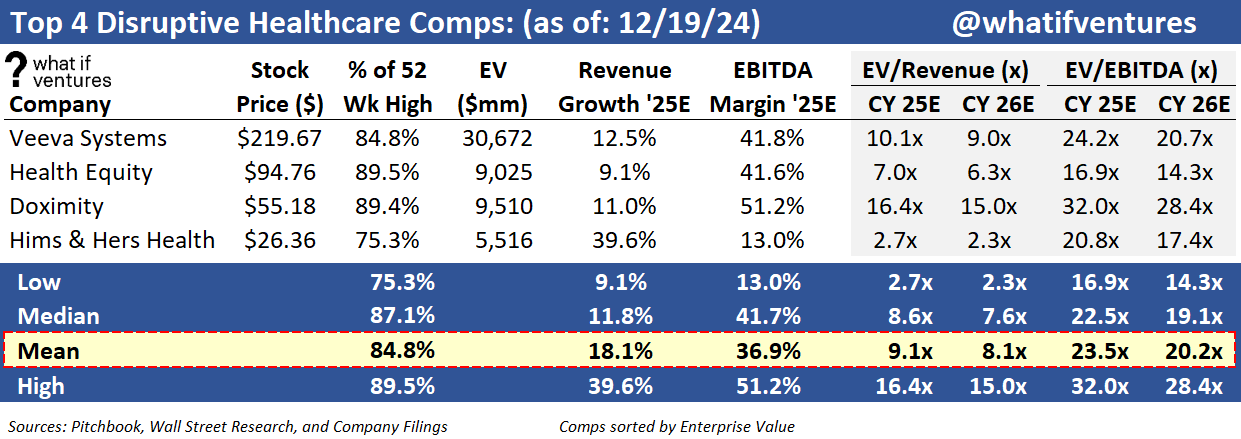
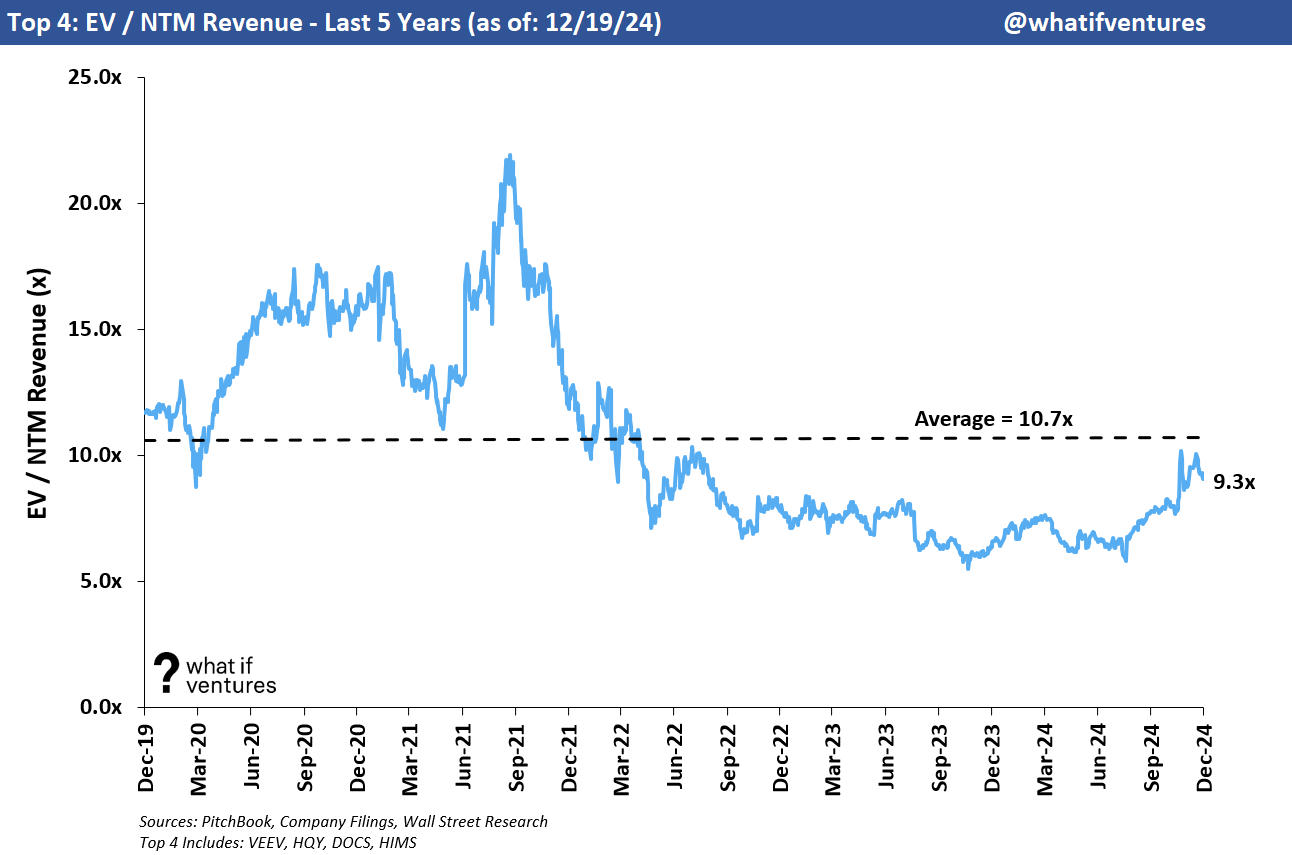
Top 4 Revenue Multiples:
This top 4 group is a subset of the broader disruptive healthcare peer set. These 4 currently have the greatest EV / 2025 Revenue multiples of the broader group. These 4 companies as a group trade at 9.1x 2025E revenue versus the broader group at 3.6x. This group also boasts an average EBITDA margin of 36.9% on 2025E projections versus the broader group at 17.4% 2025E EBITDA margin.
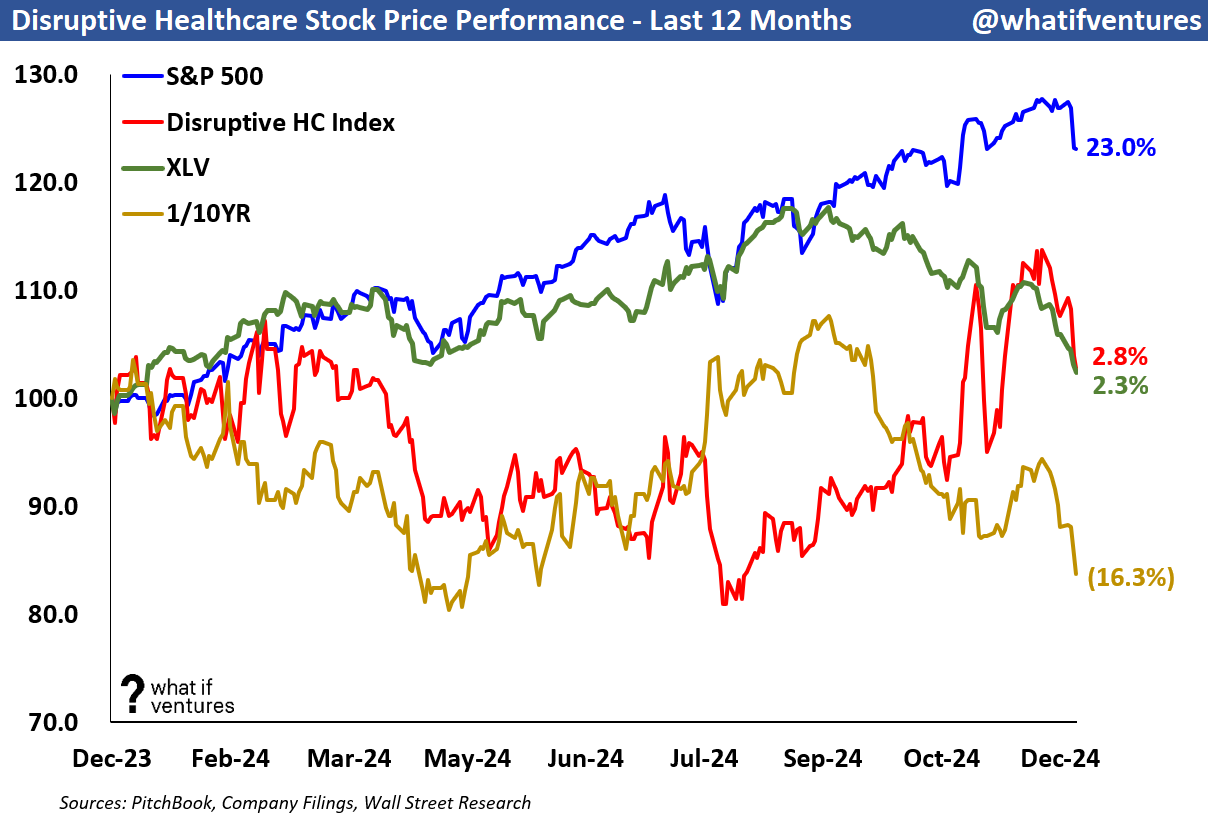
Disruptive HC Peer Stock Price Performance:
Our peer group has lagged the XLV and the S&P500 for the last 12 months. Toward the end of November, our peer group bumped up against the XLV on an LTM basis and even peaked above as you can see the red line in the chart below crossing the green line a few weeks ago. However, our peers have returned to the mean versus the XLV. This just hasn’t been our year.
Peer performance vs. broader market over the last 12 months:
Peer performance vs. broader market over the last 1 week:
In the last week, rates have driven the conversation. Just about everything has moved with rates and rate expectations in the public markets.

Stock Price Performance by Company:

Valuation — EV / NTM Revenue:
Mature healthcare comps are generally valued based on their earnings (see the broader comps at the bottom of this post). However, earlier stage businesses such as startups, and to an extent these younger, disruptive healthcare public companies often don’t have positive earnings yet or they may have positive earnings, but they haven’t reached the margin profile they will achieve upon maturity as a business. As a result, it’s harder to compare these companies on an apples-to-apples basis using EV to earnings. So, we use EV/NTM revenue to triangulate valuation for these companies and for startups in similar markets.
Summary of EV / NTM Revenue Valuation Stats:
5 Year Average: 6.4x
Today: 3.7x
Peak: 16.0x
Trough: 2.4x

Summary of top 4 EV / NTM Revenue Valuation Stats:
5 Year Average: 10.7x
Today: 9.3x
Peak: 21.9x
Trough: 5.5x

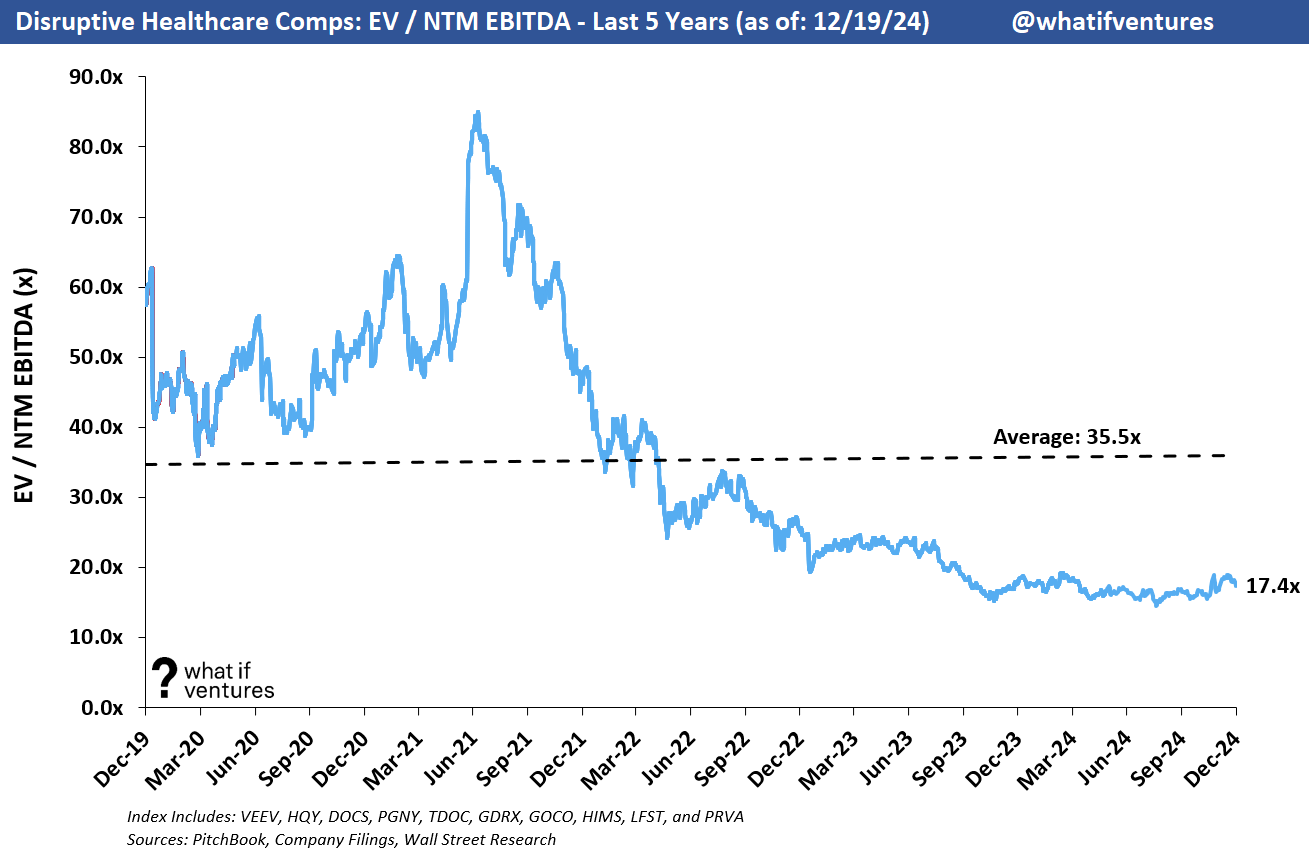
Valuation — EV / NTM EBITDA:
We were previously only looking at 8 companies from the perspective of EV/NTM EBITDA, but since Q1 earnings have reported, more analysts are projecting positive EBITDA in 2024 and beyond for more of the peers so we have expanded the index here to include 10 of the 16 companies. Based on what I’m seeing in equity research I think we will be adding a few names to this list soon as more of our peer group is starting to approach profitability.
To create an index, I only include the peers who have a substantial believable positive NTM EBITDA forecast based on the average of Wall Street equity research reports. The comps with barely positive EBITDA yield EBITDA multiples that aren’t realistic (so we consider them not meaningful “NM”).
The included companies are: VEEV, HQY, DOCS, PGNY, TDOC, GDRX, GOCO, HIMS, LFST, and PRVA. That’s not to say the other Companies won’t have positive EBITDA in 2024, but the multiples are relevant right now. Here’s how the chart looks.
Summary EV / NTM EBITDA Valuation Stats:
5 Year Average: 35.5x
Today: 17.4x
Peak: 85.0x
Trough: 14.6x
As these companies mature and begin to trade on EBITDA multiples or even P/E multiples (much like the hospital facilities and MCO peers) then this chart will tell us more. This is certainly a data point we can look at for profitable growth equity stage private companies. I’d expect those companies to be valued closer to the 5-year average or slightly lower. Some of that data in 2019 and 2020 is elevated because the EBITDA estimates back then were very small or barely positive for some of these companies driving an artificially high multiple that wasn’t driving valuation but rather was a dependent variable.
Broader Healthcare Comps as of 12/19/2024:
This newsletter is mostly focused on the disruptive healthcare comps and how their performance drives valuation for our private market portfolio at What If Ventures. However, we do keep a much broader set of comps that includes Healthcare Facilities and Managed Care Organizations.


^I realize this is too small to read, but if you double click on the image it should expand.
If you would like to receive weekly updates on this data and our outlook on the Disruptive Healthcare market, then please subscribe and share our work with a friend.
About What If Ventures — What If Ventures invests in mental health and digital health startups from seed stage to growth equity. To date, we have invested over $100mm into 83 (mostly) healthcare startups since January 2020. The firm is actively managed by Stephen Hays.
If you have questions about any of this analysis or want to collaborate with What If Ventures, please reach out via info@whatif.vc. We’d love to connect with entrepreneurs and investors in the space.
You can follow more of Stephen’s commentary on twitter here: @hazesyah
Thank you for this detailed work; USA Public is going to get Jolt ⚡️ after Jolt of Truth and no we are not ready for it.